Commercial and industrial solar buyers in Gujarat face a financing decision that is more complex than anything a residential buyer encounters. You are not just asking whether to take a loan or pay cash, you are evaluating the interaction between capital structure, tax position, balance sheet treatment, cash flow timing, energy tariff dynamics, and regulatory frameworks for open access and net metering.
The wrong financing structure costs real money. A factory that chooses an OPEX PPA when its tax position would have made CAPEX far superior is potentially leaving ₹50–80 lakh on the table over the system’s life. Conversely, a business that takes a high-interest CAPEX loan to own a system when an OPEX arrangement would have given immediate day-one savings with zero capital at risk has made the equally wrong choice in the other direction.
This guide covers every financing model available to Gujarat C&I solar buyers in 2026, with actual numbers, worked examples, and a structured framework to help your finance team choose the right structure for your business.
Direct answer. Gujarat commercial and industrial solar buyers have four primary financing models: CAPEX with own funds, CAPEX with a solar loan, OPEX/PPA (zero upfront), and RESCO. CAPEX with a loan combined with the 40% Year 1 accelerated depreciation benefit is the most financially advantageous for profitable businesses with tax liabilities. OPEX/PPA is best for businesses with capital constraints or those that prefer no ownership responsibility. The correct choice depends on your tax rate, cash reserves, cost of capital, and risk appetite.
The Gujarat C&I Solar Financing Matrix
The Gujarat C&I Solar Financing Matrix is a structured tool developed by Heaven Green Energy’s project finance team to help businesses select the right solar financing model. It maps four financing models against four critical decision factors.
| Decision Factor | CAPEX (Own Funds) | CAPEX (Solar Loan) | OPEX / PPA | RESCO |
|---|---|---|---|---|
| Upfront capital | Full system cost | 20–30% down payment | Zero | Zero |
| Monthly cash flow | Savings from Day 1 | EMI vs. savings (positive from Day 1) | Immediate savings (PPA rate vs. tariff) | Immediate savings |
| Ownership | Company owns system | Company owns system | Developer owns system | Developer owns system |
| Tax benefit (AD) | Full 40% AD available | Full 40% AD available | No AD (developer gets it) | No AD |
Reading the matrix: If your business has a strong tax position (30% corporate rate, profitable operations) and access to capital, CAPEX with own funds or a solar loan dominates, the AD benefit alone can return ₹6–12 lakh in Year 1 on a mid-size installation, and you keep all the electricity savings for 25 years. If capital is constrained or your business is in a loss position where AD has no immediate value, OPEX/PPA delivers real day-one savings with zero financial risk.
Why C&I Solar Financing Is Different from Residential
The differences between commercial/industrial solar financing and residential financing are fundamental, not cosmetic.
Scale: C&I systems range from 50 kW to 5 MW+. At ₹45–60 lakh per 100 kW, a 500 kW industrial plant costs ₹2.25–3 crore. Financing decisions at this scale go to board level and involve treasury, tax, and legal teams, not just the site manager.
Tax position matters enormously. Residential buyers cannot use accelerated depreciation; commercial and industrial buyers can. For a company paying 30% corporate tax, a ₹1 crore solar plant generates ₹12 lakh in Year 1 tax savings via the 40% AD benefit. This is a direct financial return that changes the financing calculus completely.
GST Input Tax Credit (ITC). Registered businesses can recover the 12% GST paid on solar equipment and installation as ITC, reducing the effective system cost by 10.7% (12/112). A ₹1 crore plant has ₹10.7 lakh recoverable in GST. Residential buyers cannot do this.
Open access and group captive options. For larger C&I buyers (typically 1 MW+), open access allows procurement of solar power from third-party generators through the transmission grid, bypassing the DISCOM entirely. Gujarat has active open access policies that enable very large consumers to aggregate solar from dedicated plants located anywhere in the state. This option does not exist for residential buyers.
Tariff structure complexity. C&I DISCOM tariffs in Gujarat include energy charges (per kWh), demand charges (per kVA of maximum demand), power factor incentives and penalties, fuel adjustment charges, and fixed charges. Solar can offset multiple components, not just energy charges, but only if the system is sized and designed with this in mind.
Our full analysis of the financial case for industrial solar is available in why delaying solar installation costs industries more and solar is an asset not an expense for industries.
CAPEX Model: Own the System, Keep All the Returns
In the CAPEX model, the business purchases the solar plant outright, either from its own reserves or through a solar loan, and takes full ownership of the asset.
Financial profile of CAPEX with own funds:
- No debt, no EMIs, no interest cost
- Full electricity savings from Day 1
- 40% accelerated depreciation in Year 1 (substantial tax saving)
- GST ITC recoverable on purchase
- Asset appears on balance sheet (improves asset base)
- Full generation upside for 25 years
- Residual asset value at end of life
Worked example, 200 kW industrial plant, own funds:
- Total installed cost: ₹90 lakh (₹45/W all-in, post-GST ITC recovery net cost ₹80.3 lakh)
- Year 1 AD benefit: 40% × ₹90L × 30% tax = ₹10.8 lakh tax saving
- Net effective cost after Year 1 AD: ₹90L − ₹10.8L = ₹79.2 lakh
- Annual electricity savings (at ₹9/unit, 2.8 lakh units/year): ₹25.2 lakh/year
- Simple payback after AD: 79.2 ÷ 25.2 = 3.1 years
- 25-year cumulative savings (3% tariff escalation, 0.5% degradation): approximately ₹9.5 crore
- Net 25-year profit: approximately ₹8.6 crore
The AD benefit is the critical lever in this calculation. Without it, payback would be 3.6 years, still excellent, but the AD shaves 6 months off payback and adds ₹10.8 lakh to the effective return in Year 1. Read our comprehensive accelerated depreciation guide for the full calculation methodology.
Tip: CAPEX + Loan Can Be Better Than CAPEX + Cash
If your business earns higher returns on deployed capital (say 18–25% ROCE in manufacturing), using a solar loan at 9–11% interest while deploying your own capital in the core business can produce better total returns than paying cash for the solar plant. The AD benefit is claimable on the full system cost regardless of whether you took a loan, so the tax saving is the same while your capital stays invested in higher-return activities.
IREDA and Bank Solar Loans: Options for C&I Buyers
Multiple financing institutions offer dedicated solar loan products for commercial and industrial buyers in Gujarat. Here is the landscape in 2026.
IREDA (Indian Renewable Energy Development Agency): IREDA is the dedicated central government financing institution for renewable energy projects in India. It offers term loans for commercial and industrial solar plants, typically for systems above 500 kW or in aggregated portfolios. Rates: 9.5–11% depending on project risk profile. Tenure: up to 15 years. IREDA financing is particularly relevant for larger industrial projects and RESCO developers. IREDA also finances solar projects under DREBP and PM-KUSUM, see our DREBP and PM-KUSUM guide for details.
Nationalised banks (SBI, Bank of Baroda, Canara Bank, PNB): All major nationalised banks have solar loan products under RBI priority sector lending guidelines for renewable energy. Typical terms for C&I: 9–11.5% interest, 7–12 year tenure, 20–30% promoter contribution (down payment), collateral required for amounts above ₹10 lakh. SBI’s “SBI Solar Loan” and Bank of Baroda’s “Baroda Solar Loan” are the most commonly used by Gujarat C&I buyers.
Private banks and NBFCs: HDFC Bank, ICICI Bank, Axis Bank, and several NBFCs (Tata Capital, Mahindra Finance, Arka Fincap) offer solar term loans at slightly higher rates (10–14%) but with faster processing times (2–4 weeks vs. 6–10 weeks for nationalised banks) and more flexible collateral requirements. For urgent project starts, private lenders may justify the rate premium.
| Lender Category | Interest Rate | Tenure | Down Payment | Processing Time |
|---|---|---|---|---|
| IREDA | 9.5–11% | Up to 15 years | 20–25% | 8–14 weeks |
| Nationalised banks | 9–11.5% | 7–12 years | 20–30% | 6–10 weeks |
| Private banks | 10–12% | 5–10 years | 15–25% | 3–6 weeks |
| NBFCs | 11–14% | 5–7 years | 10–20% | 2–4 weeks |
Documentation required for solar loans:
- Company financials (last 3 years audited P&L, balance sheet, cash flow)
- KYC, company registration, GST certificate, directors’ PAN/Aadhaar
- Property documents for collateral
- Solar project documents, EPC contract, DISCOM approval, panel/inverter specifications
- Bank statements (12 months)
- Energy audit or electricity bills (12 months)
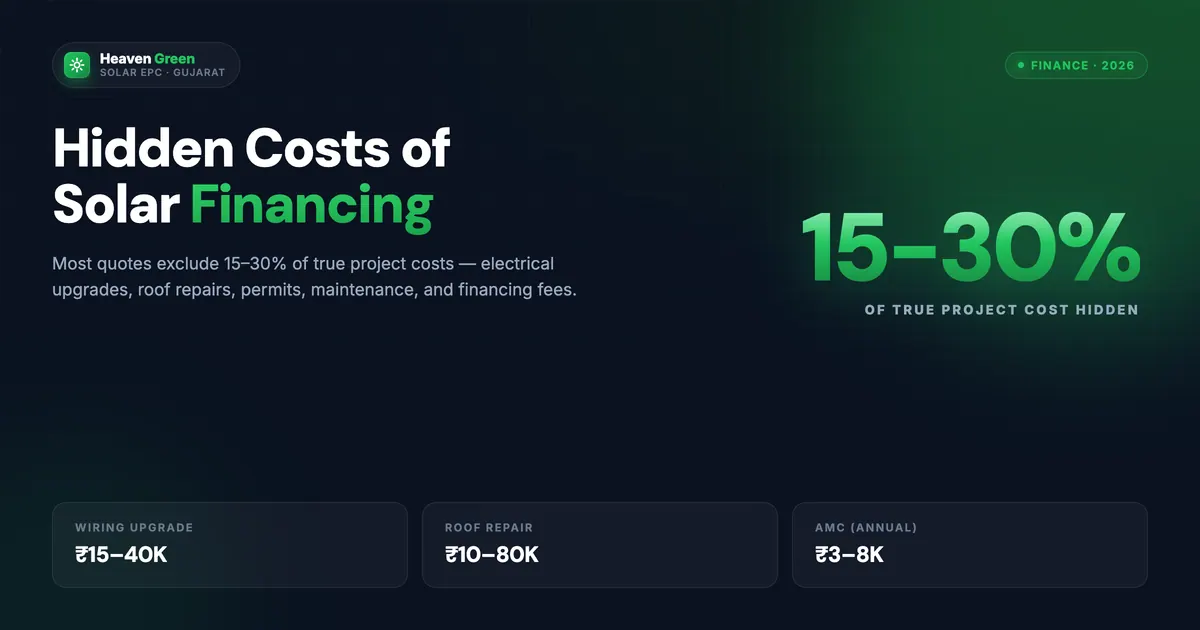
For the complete analysis of hidden financing costs that are frequently overlooked, see our hidden costs of solar financing guide.
Accelerated Depreciation: The Tax Benefit That Changes the Equation
The 40% accelerated depreciation benefit under Section 32 of the Income Tax Act is the single most powerful financial incentive available to profitable businesses investing in solar. Understanding it correctly, and structuring your purchase to capture it fully, can mean the difference between a 3-year payback and a 5-year payback.
The mechanism: Solar power plants are classified as “renewable energy devices” under the Income Tax Rules 1962 (Appendix I, Part A, Serial 8) and qualify for 40% depreciation in Year 1 on the written-down value (WDV) basis. This means 40% of the total installed cost (including GST if not recovered via ITC) is deducted from your taxable income in the year of purchase.
The calculation:
For a ₹2 crore (200 kW) industrial solar plant:
- Year 1 AD deduction: 40% × ₹2 crore = ₹80 lakh
- Tax saving at 30% rate: ₹80L × 30% = ₹24 lakh
- Tax saving at 25% rate: ₹80L × 25% = ₹20 lakh
This ₹20–24 lakh in Year 1 is a genuine cash saving, actual rupees you do not pay to the tax authority. It directly reduces the effective system cost and materially shortens payback.
Critical conditions for AD eligibility:
- The plant must be commissioned and “put to use” in the same financial year as the purchase
- The plant must be capitalised as a fixed asset in your books, not expensed
- For loans, the full asset value (not just equity contribution) is the depreciable amount
- The company must have taxable profits to deduct against; a loss-making company cannot use AD immediately (though it can carry forward losses to future years)
Timing: Commission before March 31 in any financial year to claim AD for that full year. A system commissioned on March 30 gives the same full-year AD deduction as one commissioned on April 1 of the previous year, so project timing relative to your financial year end is a genuine optimisation lever.
Regulation: AD Rate Is 40%, Not 80%
The accelerated depreciation rate for solar was reduced from 80% to 40% by the Finance Act 2017. Any installer or advisor quoting 80% AD is providing incorrect information. The current statutory rate under the Income Tax Rules 1962 is 40% WDV. Verify with your CA before planning your tax-adjusted payback calculation.
OPEX / PPA Model: Zero Capital, Immediate Savings
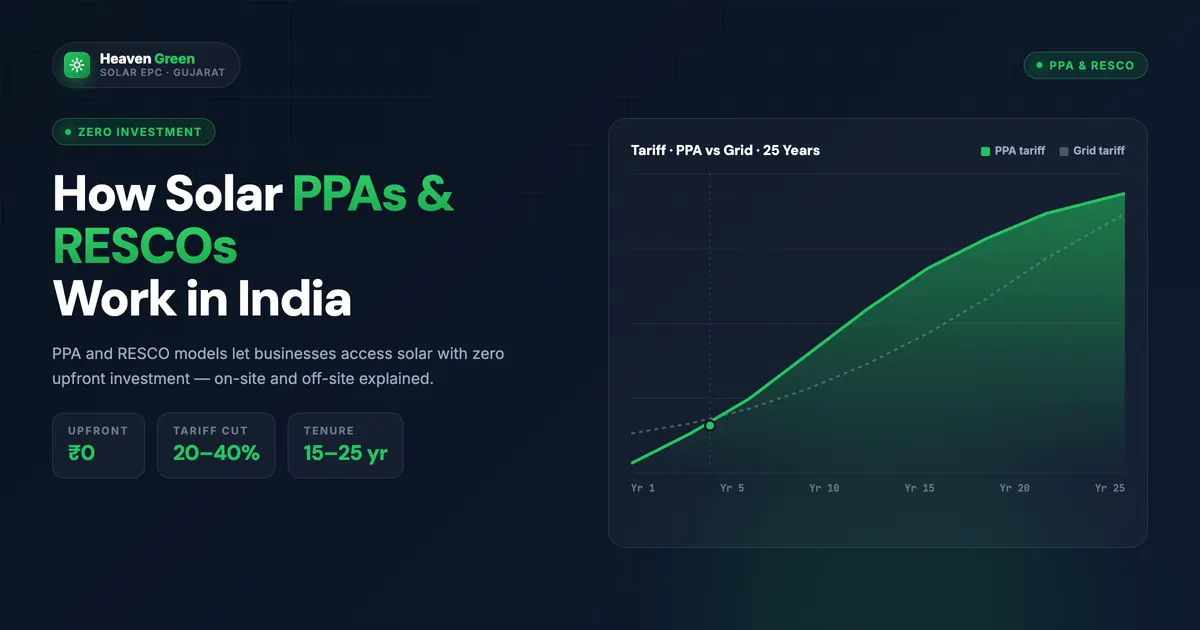
The OPEX (operational expenditure) or Power Purchase Agreement (PPA) model eliminates the capital requirement entirely. A solar developer, acting as an Independent Power Producer (IPP), installs the solar plant on your roof or nearby land at their own expense. You sign a long-term agreement (typically 15–25 years) to purchase all solar generation from the developer at a fixed per-unit tariff that is lower than your DISCOM rate.
Financial profile:
- Zero upfront investment
- Immediate bill savings from Day 1 (difference between PPA tariff and DISCOM tariff)
- You do not own the plant; the developer owns and maintains it
- You do not claim AD (the developer does)
- You do not bear O&M costs
- PPA tariff is fixed (or has a small annual escalation clause of 1–3%)
- At contract end, ownership may transfer to you (project-specific)
Worked example, 200 kW factory, OPEX PPA:
- DISCOM tariff (industrial HT): ₹9.50/unit
- PPA tariff (agreed with developer): ₹5.00/unit
- Annual generation: 2.8 lakh units
- Annual savings: 2.8L × (9.50 − 5.00) = 2.8L × ₹4.50 = ₹12.6 lakh/year
- 15-year cumulative savings (no PPA escalation): ₹1.89 crore
- 25-year cumulative savings: ₹3.15 crore
- Zero capital at risk, immediate positive cash flow
Compare this to the CAPEX own-funds example above: CAPEX delivers ₹8.6 crore over 25 years; OPEX delivers ₹3.15 crore. The CAPEX advantage is ₹5.45 crore, but only if you have the capital and the tax position to use AD. If your capital is generating 20%+ returns in the business, or if you are in a low or zero tax position, OPEX can be more rational.
PPA tariff negotiation: PPA tariffs in Gujarat for industrial rooftop solar range from ₹4.00 to ₹6.50/unit depending on system size, location, roof quality, and developer’s cost of capital. Larger systems (above 500 kW) and longer contract periods (25 years) attract lower tariffs. Always compare at least three OPEX proposals and model the 25-year NPV at your cost of capital before deciding.
For the complete comparison between CAPEX and OPEX approaches, our dedicated CAPEX vs OPEX solar guide provides additional worked examples and decision criteria.
RESCO Model: A Variation on OPEX
The Renewable Energy Service Company (RESCO) model is a variant of OPEX where the service company provides not just the solar plant but a comprehensive energy service, including O&M, monitoring, insurance, and performance guarantees. The buyer pays a flat energy fee or per-unit tariff under a longer-term service agreement.
Key differences from standard PPA:
| Feature | Standard OPEX PPA | RESCO Model |
|---|---|---|
| Who installs | Developer | RESCO company |
| Who maintains | Developer | RESCO (included in contract) |
| Performance guarantee | Project-specific | Typically guaranteed PR |
| Contract term | 10–25 years | 7–15 years typical |
| Tariff | Per unit (PPA) | Per unit or fixed monthly fee |
| Ownership transfer | At contract end (project-specific) | Often at Year 7–10 option |
RESCO models are particularly relevant for large industrial consumers (above 1 MW) who want energy cost certainty without operational involvement. Several large solar developers, Adani Solar, ReNew Power, Amp Energy, SolarEdge, operate RESCO programs in Gujarat for large C&I consumers.
Open Access Solar for Large C&I Buyers in Gujarat
For Gujarat C&I consumers with contract demand above approximately 1 MVA, open access is an option that can deliver the lowest effective solar tariff, often ₹3.50–4.50/unit all-in including wheeling and transmission charges, by sourcing power from dedicated large-scale solar plants.
Open access basics:
- The solar plant is installed at a remote location (often a solar park or agricultural land)
- Power is wheeled through the state transmission network to your factory
- You pay wheeling charges, transmission charges, cross-subsidy surcharge (CSS), and additional surcharge as applicable
- Net cost is still typically well below DISCOM tariff for HT industrial consumers
Gujarat open access regulatory framework: Gujarat’s open access policy, governed by GERC (Gujarat Electricity Regulatory Commission), allows consumers with sanctioned demand above 1 MVA to procure power from open access sources. The key charges in Gujarat include:
- Wheeling charges (state transmission): approximately ₹0.80–1.20/unit
- Cross-subsidy surcharge: approximately ₹1.20–2.00/unit (the major friction cost)
- Additional surcharge: approximately ₹0.30–0.60/unit
- Transmission losses: 3–5% energy deduction
Net open access solar tariff after all charges: typically ₹3.50–5.00/unit vs. DISCOM HT industrial tariff of ₹8–12/unit. Savings of ₹3–7/unit are still compelling.
Group captive model: The group captive structure allows multiple C&I buyers to co-invest in a solar plant with each holding at least 26% equity and consuming at least 51% of the plant’s output. This structure minimises open access charges compared to a third-party purchase arrangement. Group captive is increasingly used by mid-size industrial clusters in Gujarat.
Tip: Open Access Requires Long-Term Commitment
Open access power purchase agreements typically run 10–25 years. The cross-subsidy surcharge, which is the largest friction cost, is subject to annual revision by GERC. Model your open access economics conservatively by assuming a 3–5% annual increase in CSS over the contract period, and confirm current rates with a Gujarat regulatory consultant before signing any agreement.
GST Input Tax Credit: The Often-Missed Cost Reduction
Registered GST businesses (GSTIN holders) can recover the 12% GST paid on solar equipment and installation services as Input Tax Credit, immediately reducing the effective system cost.
How GST ITC works for solar:
When you purchase a solar system, you pay GST on the supply. As a registered business, you can claim this GST as ITC in your GST returns, offsetting your GST output liability. For a ₹1 crore solar plant with 12% GST, the GST amount is ₹10.71 lakh (12/112 of total). This is recoverable as ITC within 1–3 billing cycles.
Conditions for GST ITC on solar:
- Your business must be GST-registered and filing regular returns
- Solar generation must be used for your taxable business activities
- The invoice from the EPC contractor must show proper HSN codes for panels, inverters, and installation services
- You cannot claim ITC on the residential solar system, only for business-use installations
Interaction with AD: For AD calculation, the depreciable asset value is the cost net of GST ITC recovery (because the GST recovered is not your net cost). Confirm the correct base amount with your CA, some businesses inadvertently include recovered GST in the depreciation base, inflating the AD claim.
The full breakdown of solar taxation including GST applicability is covered in our solar panel cost breakdown.
Step-by-Step Process: Choosing the Right Financing Structure
Follow this seven-step process to determine the optimal financing structure for your C&I solar project.
-
Assess your tax position. Is your business profitable and paying corporate tax? What is your effective tax rate (22%, 25%, or 30% plus surcharge)? If you are profitable, CAPEX with AD is highly advantageous. If you are in a loss position, OPEX may be superior in the near term.
-
Calculate your cost of capital. What returns does your business generate on invested capital? If your ROCE is above 20%, deploying capital in solar at a 3–5 year payback is a good use of funds. If your ROCE is 10–12%, solar CAPEX competes well with any alternative investment.
-
Assess available capital and credit. Do you have liquid capital for a 20–30% down payment? What is your DSCR (Debt Service Coverage Ratio)? Banks require a DSCR above 1.3× for solar term loans. Calculate whether you qualify for the loan amount needed.
-
Model CAPEX vs. OPEX on a 25-year NPV basis. Use your cost of capital as the discount rate. CAPEX NPV typically exceeds OPEX NPV for profitable businesses; the question is by how much and whether the upfront capital commitment is worth it.
-
Evaluate open access eligibility. If your contract demand exceeds 1 MVA, model the open access option at current Gujarat wheeling and transmission charge rates. Include a sensitivity for a 5% annual CSS increase.
-
Check DISCOM capacity for your chosen system size. The DISCOM feasibility check (described in our solar permits in Gujarat guide) determines the maximum system capacity that can be connected on your feeder. This constrains system size regardless of your financing preference.
-
Request proposals for both CAPEX and OPEX. Even if you have a preliminary preference, having both types of proposals allows direct financial comparison, and OPEX proposals often reveal what developers believe the system’s economics look like, giving you useful benchmarking data for your own CAPEX model.
Need help modelling your C&I solar financing options with actual numbers for your business? Heaven Green Energy’s project finance team runs full CAPEX/OPEX/open access analysis for Gujarat industrial clients at no obligation. Contact our team today or use our Solar Calculator to get a starting estimate.
Common Financing Mistakes C&I Buyers Make
Even sophisticated businesses make predictable errors when financing large solar projects. Here are the five most common, and how to avoid them.
Mistake 1, Comparing OPEX and CAPEX on the wrong metric. Comparing OPEX monthly savings to CAPEX payback period is not an apples-to-apples comparison. The correct comparison is 25-year Net Present Value at your cost of capital. Always model both options over the full system life.
Mistake 2, Not claiming AD in the correct year. AD is claimable in the year the asset is “put to use.” A system commissioned on April 2 goes into the next financial year’s books. Many businesses lose a full year of AD because they commission in April instead of March. Plan commissioning dates relative to your financial year end.
Mistake 3, Using the wrong depreciation base. The AD base is the full installed cost including GST if GST is not recovered via ITC. If you do recover GST as ITC, the AD base is the net cost (excluding recovered GST). Using the wrong base understates or overstates your tax saving.
Mistake 4, Signing OPEX PPAs without escalation clause analysis. A PPA tariff of ₹5/unit with a 3% annual escalation clause reaches ₹9.03/unit by Year 20, potentially above your DISCOM tariff after 20 years of tariff increases. Always model the 25-year trajectory of both the PPA tariff and the DISCOM tariff before signing.
Mistake 5, Not accounting for open access charge revisions in long-term models. Cross-subsidy surcharge rates in Gujarat have been revised upward historically. A 10-year open access model that assumes static CSS will overstate savings. Build in a conservative escalation for regulatory risk.
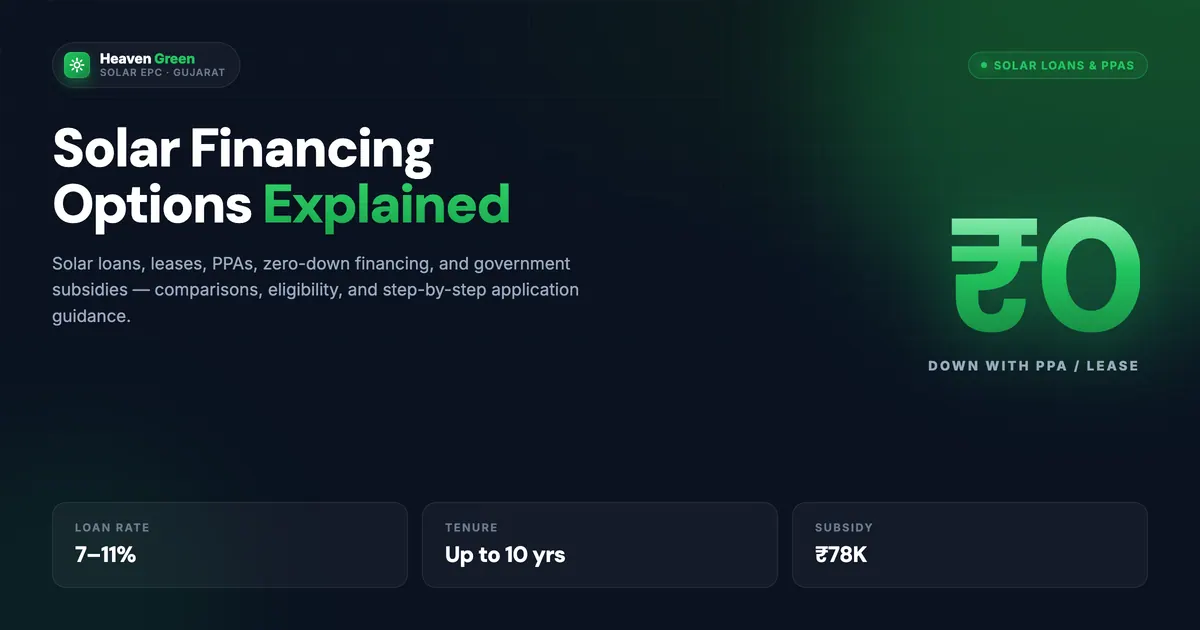
Our hidden costs of solar financing guide and solar financing options explained cover these and other financing pitfalls in depth.
CAPEX Model: Best For
- Profitable businesses with tax liability
- Companies with available capital or credit
- Long-term operations at same site (10+ years)
- Businesses seeking balance sheet asset
- Companies wanting full O&M control
- Maximum 25-year financial return
OPEX/PPA: Best For
- Capital-constrained businesses
- Loss-making or low-tax businesses
- Businesses wanting zero O&M responsibility
- Companies preferring off-balance-sheet financing
- Sites with uncertain long-term use
- Immediate day-one savings with no risk
Financing Timeline: What to Expect
Understanding the timeline for each financing model prevents project delays that erode financial returns.
| Financing Stage | CAPEX (Bank Loan) | OPEX/PPA |
|---|---|---|
| Financial analysis and structure decision | 1–2 weeks | 1–2 weeks |
| EPC contractor selection and quotation | 2–4 weeks | 1–2 weeks (developer proposes) |
| Loan application and sanction | 6–12 weeks | Not applicable |
| DISCOM feasibility check | 2–4 weeks | 2–4 weeks (developer handles) |
| Equipment procurement | 3–6 weeks | Developer handles |
| Civil and electrical installation | 3–6 weeks | Developer handles |
| DISCOM inspection and net metering | 4–8 weeks | Developer handles |
| Total timeline from decision to savings | 20–36 weeks | 12–20 weeks |
OPEX projects move faster because the developer is motivated by immediate revenue from the PPA and handles all administrative steps. CAPEX projects with bank financing involve the loan sanction process, which adds significant time, this is why some businesses with available capital choose to fund the initial project from their own funds and refinance later.
How Heaven Green Energy Helps
Heaven Green Energy’s commercial and industrial project team offers complete support across every financing model, from CAPEX loan structuring to OPEX PPA facilitation and open access advisory.
- CAPEX financial modelling: Our team builds detailed 25-year financial models, including AD calculation, GST ITC recovery, loan amortisation, and escalating tariff savings, to give your finance team the numbers they need to make the decision. Explore our commercial solar services.
- Bank and IREDA loan facilitation: We work with a network of banking and NBFC relationships to help C&I clients access competitive solar loan financing, including preparation of the project documentation package that banks require. Contact our team for a financing consultation.
- OPEX PPA structuring and evaluation: For businesses considering OPEX, we help evaluate PPA proposals from third-party developers, model 25-year NPV, and identify the tariff and escalation terms that protect your long-term economics. See our industrial solar page for scope details.
- Open access and group captive advisory: For large consumers above 1 MVA, our regulatory team analyses open access options under current GERC rules, models net tariff after all charges, and helps structure group captive arrangements for industrial clusters. Our complete guide to solar installation in Gujarat provides context on the regulatory landscape.
Frequently Asked Questions
Q1. Can a company claim accelerated depreciation if it finances the solar plant with a bank loan?
Yes. Accelerated depreciation is claimed on the full installed cost of the solar plant, not just the equity contribution. Even if you put in only 25% down and the bank finances the rest, you claim 40% AD on the total project cost. The loan repayment is a separate cash flow; the AD benefit is based on the asset’s total capitalised value.
Q2. What is the minimum system size for an OPEX PPA to be commercially viable in Gujarat?
Most OPEX developers in Gujarat require a minimum system size of 100–200 kW and a minimum annual generation of approximately 1.5–2 lakh units to make the project economically viable for them. Below this threshold, the developer’s transaction costs and O&M overhead make per-unit economics unattractive. For systems below 100 kW, CAPEX is almost always the only viable model.
Q3. Can GST Input Tax Credit be claimed immediately or is there a waiting period?
GST ITC can be claimed in your next GSTR-3B filing after the tax invoice is received and the goods/services are received and accounted for. There is no mandatory waiting period, but ITC must be claimed before the annual return deadline. For large solar projects where ITC exceeds your current GST output liability, the credit can be carried forward and utilised in subsequent months.
Q4. How does accelerated depreciation interact with MAT (Minimum Alternate Tax)?
Companies subject to MAT (Minimum Alternate Tax under Section 115JB) cannot reduce their MAT liability using AD, MAT is calculated on book profits, not taxable income. However, the tax benefit from AD (the difference between normal tax and MAT) accrues as MAT credit that can be carried forward and offset against regular tax in future years when regular tax exceeds MAT. This makes AD valuable even for MAT-paying companies, just with a timing difference.
Q5. Is OPEX/PPA available for rooftop solar on rented factory premises?
OPEX on rented premises is possible but requires the landlord’s consent since the solar developer will be installing equipment on the roof and has an interest in the roof’s use for the contract period. Most PPA agreements include provisions requiring landlord/owner consent and specifying what happens if the lease terminates early. Obtain written landlord consent before signing a PPA.
Q6. What is the difference between a PPA and a solar lease?
A PPA (Power Purchase Agreement) charges you per unit of electricity generated, if the system produces more, you pay more; if it produces less (cloudy months), you pay less. A solar lease charges a fixed monthly fee regardless of generation. For industrial buyers with predictable consumption, a PPA is generally preferred because it aligns payment with actual benefit received.
Q7. Do open access solar charges make it unviable for smaller C&I consumers in Gujarat?
Open access in Gujarat is generally viable for consumers with contract demand above 1 MVA (roughly above 500 kW system equivalent). For smaller consumers, the fixed costs and cross-subsidy surcharge make open access uneconomical. Below 1 MVA, rooftop solar with net metering is the most appropriate option. Our rooftop solar in Gujarat guide covers the net metering option for smaller C&I consumers.
Q8. How should I compare CAPEX and OPEX financially?
The correct comparison is 25-year Net Present Value (NPV) discounted at your company’s weighted average cost of capital (WACC). CAPEX NPV = −Initial Investment + Sum of (Annual Savings × AD Benefit in Year 1) / (1+WACC)^t. OPEX NPV = Sum of (DISCOM Tariff − PPA Tariff) × Annual Units / (1+WACC)^t. The model with the higher NPV is financially superior for your business. Our team can build this model for your specific situation.