Every commercial or industrial buyer who approaches us eventually asks the same question: should we own our solar system outright or let someone else finance it and simply pay for the power?
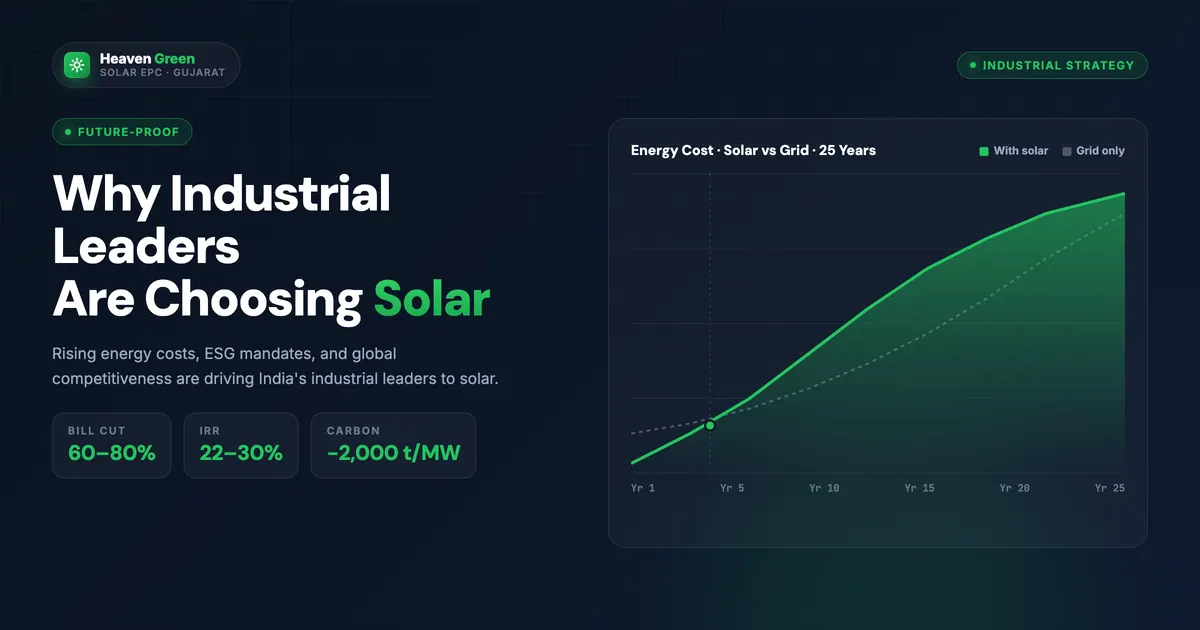
That question is the OPEX vs CAPEX decision, and in 2026, with grid tariffs in Gujarat running ₹7–₹12/kWh for commercial and industrial consumers, it carries serious money on both sides.
This guide breaks down both models completely, runs the real numbers on a 100 kW factory example, and gives you a five-question decision framework so you can stop second-guessing and start generating.
CAPEX solar delivers a 3.5–5 year payback and unlocks 40% Accelerated Depreciation for profitable Indian companies, making it the stronger long-term choice for owned-property businesses earning above ₹50 lakh taxable profit per year. OPEX (PPA/RESCO) is the right answer when capital is constrained, the property is leased, or ownership stability is uncertain, offering zero upfront cost and guaranteed savings from Day 1.
What CAPEX and OPEX Actually Mean in Solar
In industrial finance, CAPEX (Capital Expenditure) is spending that puts an asset on your balance sheet. OPEX (Operational Expenditure) is a recurring expense that flows through the P&L.
Applied to solar:
CAPEX model: Your company pays the full system cost upfront, typically ₹60–₹80 per watt-peak (Wp) for C&I systems in 2026. You own the panels, inverters, and structure. You collect all electricity savings. You are eligible for Accelerated Depreciation (AD) under the Income Tax Act.
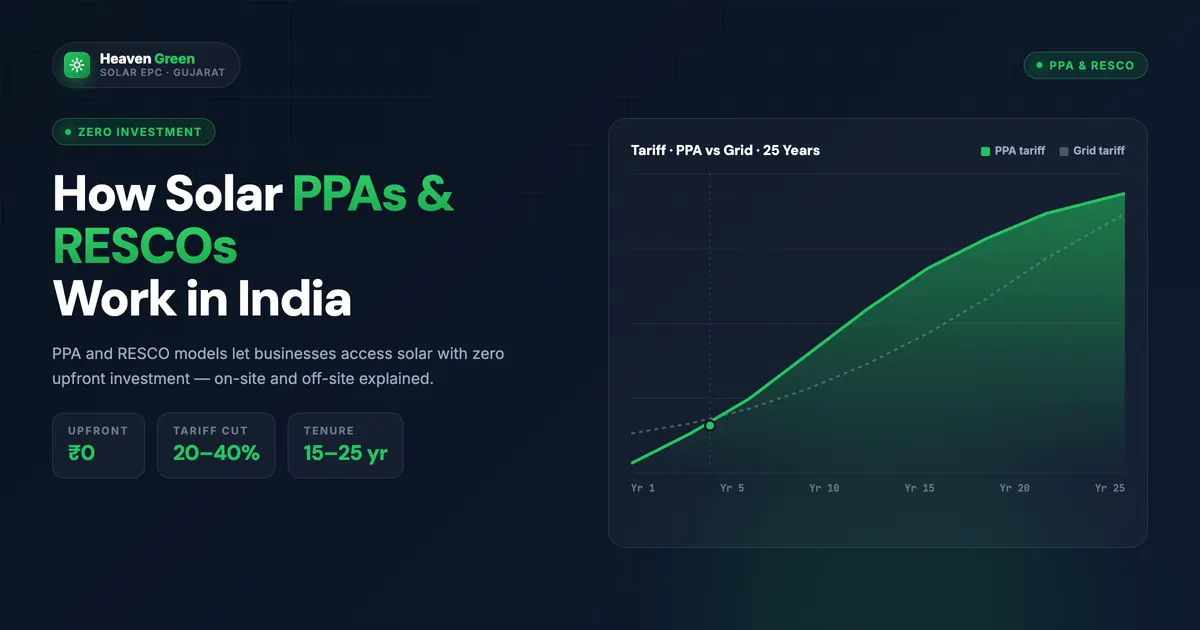
OPEX model (PPA / RESCO): A solar developer finances, installs, owns, and operates the system on your premises or nearby. You pay nothing upfront and simply purchase the electricity generated at a fixed PPA tariff, typically ₹3.50–₹5.50/kWh for C&I customers in 2026, compared to grid rates of ₹7–₹12/kWh. The developer owns the asset for the full PPA term, usually 10–25 years.
CAPEX Lite / Hybrid: A middle path offered by select developers, 20–30% down from the buyer, the rest financed through a developer-arranged loan or equipment lease. The buyer owns the asset from Day 1 but without draining the entire capital budget.
💡 Fast tip
Neither model is universally better. The right answer depends on your company's tax position, capital availability, property ownership status, and long-term location plans. Run through the decision framework below before committing to either path.
CAPEX vs OPEX: The Full Comparison
| Factor | CAPEX (Own) | OPEX (PPA/RESCO) |
|---|---|---|
| Upfront cost | ₹60–₹80/Wp (full system cost) | ₹0 |
| Who owns the system | Your company | Developer/RESCO |
| Monthly cash flow | No recurring solar payment; net savings from Year 1 | Monthly PPA bill (₹3.50–₹5.50/kWh), still lower than grid |
| Accelerated Depreciation (40% Year 1) | Yes, available to asset owner | No, benefit goes to developer |
| O&M responsibility | Yours (or outsourced via AMC) | Developer’s responsibility |
| Tariff risk | None after installation (zero fuel cost) | PPA tariff has annual escalation clause (typically 1–3%/yr) |
| Balance sheet impact | Adds asset, adds depreciation | Off-balance-sheet expense |
| Exit flexibility | Sell system with property; full asset control | Locked into PPA term (exit penalties apply) |
| Best for | Profitable companies, owned property | Cash-constrained, leased premises |
| Payback period | 3.5–5 years (post-AD for profitable firms) | No “payback”, savings start Day 1, no asset accumulated |
The Accelerated Depreciation Advantage, Explained
This is the single biggest reason profitable companies choose CAPEX.
Under Section 32 of the Income Tax Act, solar power plants qualify for 40% Accelerated Depreciation in Year 1 under the Written Down Value (WDV) method. For a company in the 30% tax bracket:
- System cost: ₹65 lakh (100 kW at ₹65/Wp)
- AD claim in Year 1: 40% × ₹65 lakh = ₹26 lakh depreciation deduction
- Tax saved in Year 1: ₹26 lakh × 30% = ₹7.8 lakh
- Net effective cost after AD: ₹65 lakh − ₹7.8 lakh = ₹57.2 lakh
This tax saving directly compresses the payback period. A business that ignores this benefit when modeling CAPEX is underestimating its return by roughly 12%.
Note: Companies with low or zero taxable profit receive no value from AD. For them, OPEX is genuinely more attractive.
⚠️ Watch out
Accelerated Depreciation is only available to the legal owner of the solar asset. Under an OPEX/PPA arrangement, the developer owns the system and claims the AD benefit, not your company. Always confirm asset ownership clauses before signing a PPA or RESCO agreement.
Real Numbers: 100 kW Factory in Surat
Let’s build a concrete comparison for a 100 kW rooftop solar system at a manufacturing unit in Surat, Gujarat.
System assumptions:
- Installed capacity: 100 kW
- Average generation: 130,000–140,000 kWh/year (Surat: ~1,350–1,400 peak sun hours/year)
- Current grid tariff: ₹9/kWh (industrial HT consumer)
- Company tax bracket: 30%
CAPEX Scenario
| Item | Value |
|---|---|
| System cost (₹65/Wp × 100,000 Wp) | ₹65,00,000 |
| Year 1 AD benefit (40% × 30% tax) | −₹7,80,000 |
| Net effective investment (post-AD) | ₹57,20,000 |
| Annual generation | 1,35,000 kWh |
| Annual savings at ₹9/kWh | ₹12,15,000 |
| Plus: avoided grid charges & demand charges | ₹3,00,000–₹5,00,000 |
| Total annual benefit | ₹15,15,000–₹17,15,000 |
| Simple payback period (post-AD) | 3.3–3.8 years |
| 25-year net savings (no escalation) | ~₹3.2–3.8 crore |
OPEX Scenario (PPA at ₹4.50/kWh)
| Item | Value |
|---|---|
| Upfront investment | ₹0 |
| Annual generation | 1,35,000 kWh |
| Annual PPA payment (₹4.50/kWh) | ₹6,07,500 |
| Annual grid cost avoided (₹9/kWh) | ₹12,15,000 |
| Annual net saving (PPA vs grid) | ₹6,07,500 |
| PPA tariff escalation (2%/yr, 25 yr) | Reduces savings over time |
| Asset ownership at end | None (unless buyout option exercised) |
| 25-year net savings (approx., 2% escalation) | ~₹1.2–1.6 crore |
Conclusion from numbers: The CAPEX model generates roughly 2× the lifetime savings versus OPEX for a company that owns its property and has taxable profit. OPEX still saves money, but the developer captures a significant share of the value.
10-Year NPV Comparison (at 3 Tariff Escalation Scenarios)
Below is a net present value (NPV) comparison of CAPEX vs OPEX for the same 100 kW Surat factory, discounted at 12% (typical Indian industrial WACC) — a companion metric to IRR when comparing project returns. All figures in ₹ lakh.
| Scenario | Grid Tariff Escalation | CAPEX NPV (10 yr) | OPEX NPV (10 yr) | CAPEX Advantage |
|---|---|---|---|---|
| Low escalation | 3%/year | ₹42 lakh | ₹18 lakh | +₹24 lakh |
| Moderate escalation | 5%/year | ₹51 lakh | ₹24 lakh | +₹27 lakh |
| High escalation | 8%/year | ₹64 lakh | ₹34 lakh | +₹30 lakh |
Note: CAPEX NPV includes AD benefit in Year 1. OPEX NPV reflects net savings (grid avoided minus PPA payments). Higher grid tariff escalation benefits CAPEX more because owned-system savings grow while PPA tariff also rises.
According to data from MNRE’s annual solar capacity reports, Indian grid tariffs have escalated at 4–6% annually over the past decade, placing the “moderate escalation” scenario as most realistic.
The C&I Energy Independence Decision Framework
Use these five questions to determine the right model for your business. We call this the C&I Energy Independence Decision Framework.
-
Does your company have taxable profit above ₹50 lakh/year? Yes → CAPEX strongly preferred. The Accelerated Depreciation benefit is significant at this level and meaningfully compresses payback. No → OPEX or loan-backed CAPEX.
-
Do you own the property where solar will be installed? No (leased premises) → OPEX preferred. Installing a CAPEX system on a leased property creates asset-recoverability risk if the lease ends. Most landlords also resist bearing removal costs. Yes → Both models viable; proceed to next question.
-
Is your current electricity bill above ₹3 lakh/month? Yes → Both models are financially compelling. Run an NPV comparison (use our Solar Calculator). No → OPEX may offer better cash-flow optics even if CAPEX is marginally stronger on NPV.
-
What is your target payback period? Under 4 years → CAPEX with AD benefit typically achieves this. Zero upfront, don’t care about asset accumulation → OPEX.
-
Do you have capital available, or is that capital better deployed in core operations? Capital available and ROE on solar exceeds alternative use → CAPEX. Capital tied up or opportunity cost is high → OPEX or loan-backed CAPEX.
OPEX: When It Makes Genuine Sense
OPEX is not the “worse” model, it is the right model in specific situations. Do not let the NPV comparison above dismiss it unfairly.
See our zero down payment solar guide for a closer look at how OPEX/PPA structures eliminate upfront cost entirely.
OPEX works well when:
- Your business is a startup or SME that cannot commit ₹40–₹80 lakh to a non-core asset
- You operate from leased commercial or industrial space where CAPEX recovery is uncertain
- Your company is in a low or zero taxable profit phase, AD benefit has no value to you
- Your electricity consumption is seasonal or irregular: OPEX tariff scales with actual generation
- You want zero O&M responsibility: under OPEX, all maintenance, monitoring, and insurance sit with the developer
- You’re testing solar before a larger commitment: a PPA on one building gives you operating experience before a group-level CAPEX decision
For sector-specific breakdowns of this same decision, see our guides on OPEX vs CAPEX solar for hospitals and OPEX vs CAPEX for the textile industry, or the broader OPEX vs CAPEX decision guide for commercial solar buyers.
According to CEEW’s India Commercial Solar Report 2025, the OPEX/PPA model accounts for roughly 35% of new C&I solar capacity additions in India, with CAPEX at ~55% and hybrid models at ~10%.
Bridge to India’s C&I solar market analysis similarly notes that the OPEX segment is growing faster among mid-market SMEs while large industrial consumers continue to prefer CAPEX due to the AD advantage.
Pros and Cons at a Glance
- Full system ownership, 25-year asset on your books
- 40% Accelerated Depreciation lowers net cost significantly
- Higher lifetime savings, 2× vs OPEX in most scenarios
- Zero fuel cost after payback, pure saving
- No lock-in, freedom to modify, expand, or sell system
- Large upfront capital outlay (₹40–₹80 lakh for typical C&I)
- O&M responsibility falls on your company
- AD benefit is useless if you have low taxable profit
- Risky on leased property
- Zero upfront investment, immediate cash-flow positive
- Developer handles all O&M, insurance, monitoring
- Works on leased premises (asset never owned by tenant)
- Off-balance-sheet structure keeps debt ratios clean
- Suits companies with low/zero taxable profit
- Lower lifetime savings, developer keeps majority of value
- Long-term lock-in (10–25 years) with exit penalties
- No AD benefit to buyer
- PPA tariff escalation erodes savings over time
- Developer quality risk, a poorly run RESCO affects your power supply
A Note on Solar Financing for CAPEX Buyers
For companies that prefer ownership but are concerned about the upfront cost, loan-backed CAPEX is a well-established path. Several banks and NBFCs offer solar project finance at 9–12% per annum for commercial and industrial systems, and our solar loan EMI comparison breaks down rates across major lenders.
The math still works: even with debt service, the annual savings from a 100 kW system typically exceed the EMI obligation, producing positive cash flow from Day 1 while you own a depreciating asset.
According to Mercom India’s Q1 2026 C&I Solar Market Report, approximately 40% of CAPEX C&I installations in India in 2025–26 used some form of debt financing rather than pure equity.
Our guide on solar payback period calculations walks through the loan vs equity comparison in detail.
Get a free solar assessment. Our engineers visit within 24 hours and run the CAPEX vs OPEX comparison for your specific load profile and tariff category. Get your free quote →
How Heaven Green Energy Helps
Heaven Green Energy has completed 10,000+ solar installations across Gujarat, including significant commercial solar and industrial solar projects across Ahmedabad, Surat, Rajkot, Vadodara, and Morbi.
We structure both CAPEX and OPEX projects for C&I clients. Here is how we support each model:
For CAPEX buyers:
- Full solar EPC services: design, procurement, installation, commissioning
- Net metering documentation and DISCOM liaison
- Annual Maintenance Contract (AMC) options post-installation
- AD documentation support, we provide all asset certificates required by your CA
For OPEX / PPA exploration:
- We help you evaluate third-party PPA offers and review PPA agreement terms
- We model the true 25-year NPV comparison so you can negotiate from knowledge, not guesswork
- For clients on leased premises, we connect you with vetted RESCO partners
CAPEX Lite: We also structure hybrid arrangements, typically 25–30% down, with the balance financed through our lending partners, for clients who want ownership but need to preserve working capital.
Our process:
- Site survey and load analysis (free, within 24 hours of enquiry)
- CAPEX vs OPEX financial model, specific to your tariff category and tax position
- System design and equipment recommendation
- Permit applications and DISCOM coordination
- Installation and commissioning, typically 4–6 weeks for C&I systems up to 500 kW
- Handover, monitoring setup, and AMC activation
Our solar EPC service page has full details on project timelines and documentation requirements.
Common Questions from C&I Buyers
For more on the OPEX/PPA structure specifically, our guide on how solar PPAs and RESCOs work in India covers agreement terms, performance guarantees, and what to look for in a PPA contract.
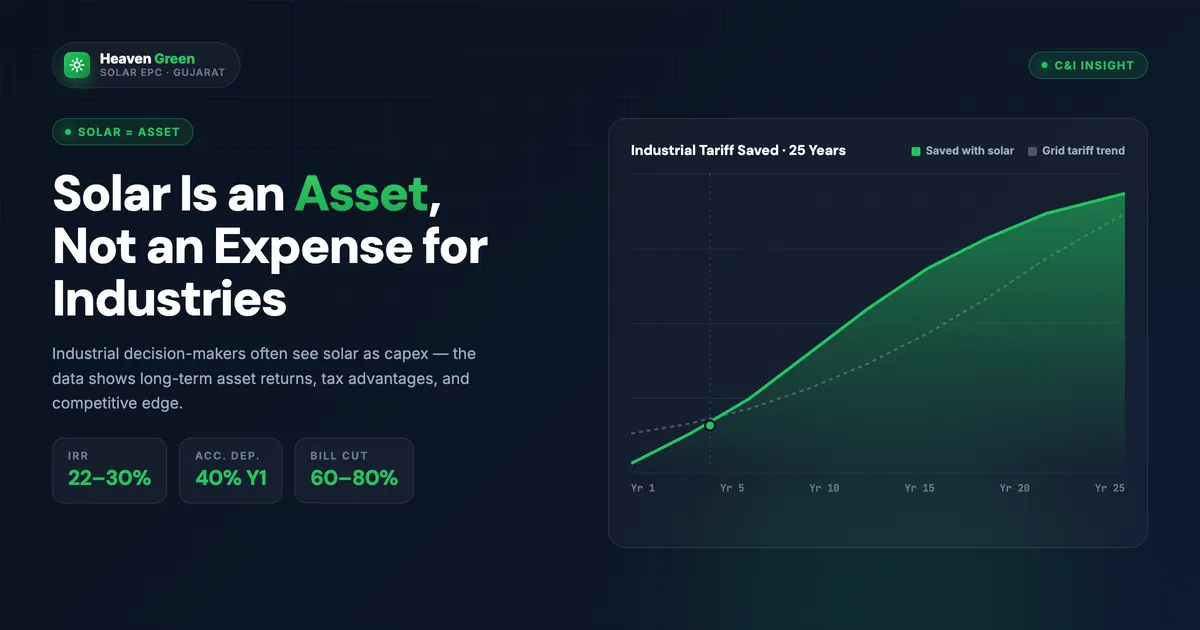
For the broader case for treating solar as a business investment rather than an expense, read why solar is an asset, not an expense, for Indian industries.
Frequently Asked Questions
Can a company use both CAPEX and OPEX for different buildings?
Yes. Many multi-site industrial groups use CAPEX for owned properties (to capture AD) and OPEX/PPA for leased facilities where asset ownership is impractical. The two models are not mutually exclusive.
What is the current Accelerated Depreciation rate for solar in India?
Under the Income Tax Act, solar power plants are eligible for 40% depreciation in Year 1 under the WDV (Written Down Value) method. This rate has been stable for several years. Confirm with your CA, as your effective benefit depends on your profit position and tax bracket.
Is OPEX/PPA available for rooftop systems below 100 kW?
Most RESCO/PPA developers in India focus on systems above 100 kW (larger ticket size justifies their transaction costs). For smaller systems, CAPEX with bank financing is typically the only viable path. Some developers offer group-aggregation schemes for smaller consumers, inquire with us directly.
Who is responsible for panel cleaning and maintenance under OPEX?
The developer/RESCO is responsible for all operations and maintenance under a standard PPA agreement. This includes panel cleaning, inverter servicing, monitoring, and insurance. Confirm this is explicitly stated in your agreement.
Can I buy out the system from the developer at the end of the PPA term?
Most PPA contracts include a buyout option at the end of the term, typically at a nominal or pre-agreed value (sometimes as low as ₹1 for a fully depreciated system). Negotiate this clause upfront, it is standard practice and should not be difficult to include.
Does OPEX save less money than CAPEX in all cases?
In most realistic scenarios for profitable companies with owned property, yes, CAPEX generates higher lifetime savings. The exception is when cost of capital is very high (opportunity cost of capital exceeds solar IRR), where OPEX’s zero-capital requirement can be preferable even for profitable companies.
What happens to net metering under an OPEX arrangement?
Under most OPEX/PPA structures, the net metering connection is in the developer’s name, and any export credits flow to the developer. If net metering credits are material to your economics, a CAPEX model gives you direct access to those benefits.
Is there a minimum system size for CAPEX AD benefits?
No minimum size is specified in the Income Tax Act. The AD benefit is available for any solar power plant owned as a business asset, regardless of system size.
How do I compare OPEX tariff quotes from different developers?
Always compare on: (a) the base tariff in Year 1, (b) the annual escalation rate, (c) the PPA term length, (d) the performance guarantee (minimum PLF or generation commitment), and (e) the exit penalty structure. A low Year 1 tariff with a 5% annual escalation may be worse over 15 years than a slightly higher tariff with 2% escalation.
Where can I see real project examples from Heaven Green Energy?
Visit our industrial solar solutions page and commercial solar service page for project snapshots across Gujarat. Or call us directly at +91 63904 05060 for a reference visit to a nearby installation.