When two solar installers quote you the same 5 kW system at the same price, the difference that determines which one generates more electricity over 25 years is almost always panel efficiency. It is the single most misunderstood number in a solar proposal, and yet most buyers never ask about it.
Panel efficiency tells you how much of the sunlight hitting your roof actually becomes electricity. A 20% efficient panel converts one-fifth of incoming solar energy into usable power. The rest is lost as heat. That gap between what hits your roof and what flows into your home determines every generation estimate your installer gives you, and, over a 25-year system life in Indian conditions, that gap compounds into lakhs of rupees.
This guide covers exactly what efficiency means, how it is measured, how the three main technologies, Mono PERC, TOPCon, and HJT, compare in real Indian conditions, and how to use efficiency to evaluate competing quotes intelligently.
Direct answer. Solar panel efficiency for modules sold in India ranges from 19–22% for Mono PERC, 21–24% for TOPCon, and 23–25% for HJT panels. In real rooftop conditions in India, where summer cell temperatures reach 55–65 °C and ambient temperatures average 35–45 °C, effective output runs 10–18% below the lab-rated figure, which is why temperature coefficient and technology choice matter as much as the headline efficiency number.
What Solar Panel Efficiency Actually Means
Efficiency is the ratio of electrical power output to the solar power input striking the panel surface, expressed as a percentage. Under Standard Test Conditions (STC), 1,000 watts of solar irradiance falls on every square metre of panel area. If a panel produces 200 W of electricity from that 1,000 W input, its efficiency is 20%.
The formula is straightforward:
Efficiency (%) = Power output (W) ÷ (Panel area in m² × 1,000 W/m²) × 100
A 540W panel measuring approximately 2.278 m × 1.134 m has an area of 2.58 m². At STC, 2,580 W of solar energy strikes it. If the panel outputs 540 W, its efficiency is 540 ÷ 2,580 × 100 = 20.9%.
This definition matters because it allows direct comparison between panels of different physical sizes. A smaller 400W panel and a larger 540W panel can both be described as “20% efficient”, meaning they extract the same proportion of energy from every square metre of roof. The 540W panel simply covers more roof area. Conversely, a 540W panel with 22% efficiency is physically smaller than a 540W panel at 20% efficiency for the same wattage.
Why efficiency matters more than wattage alone
Wattage tells you the absolute output of one panel. Efficiency tells you how good that panel is at using its roof space. For Indian homeowners with limited roof area, typically 50–80 m² of usable shadow-free surface on a 3BHK, squeezing more kilowatts into a fixed area requires higher efficiency.
Consider two 5 kW systems:
- Option A: Thirteen 400W Mono PERC panels at 19.5% efficiency, requires about 24 m² of roof
- Option B: Ten 540W TOPCon panels at 21% efficiency, requires about 26 m² of roof for the same generation, but uses only 10 mounting structures instead of 13
Option B generates more energy per unit area and reduces balance-of-system cost. For a deeper look at how panel selection shapes total system economics, see our guide on how to choose solar modules.
STC vs NOCT: the lab-to-rooftop gap
Every panel’s efficiency rating comes from an STC test: controlled temperature of 25 °C, irradiance of 1,000 W/m², and AM 1.5 spectrum. These conditions do not exist on an Indian rooftop in May.
The Nominal Operating Cell Temperature (NOCT) test is more realistic: 800 W/m² irradiance, 20 °C ambient, 1 m/s wind. Under NOCT, cell temperatures typically reach 45–48 °C, and panel output falls by 5–8% compared to STC.
In an Indian summer, cell temperatures can reach 65–75 °C on a poorly ventilated rooftop. At that temperature, a Mono PERC panel with a temperature coefficient of −0.37%/°C loses (65 − 25) × 0.37% = 14.8% of its rated output versus STC. A TOPCon panel at −0.30%/°C loses 12% under identical conditions. That 2.8% difference in real-world output for the same nominal efficiency is why technology choice matters for Indian buyers.
Mono PERC Efficiency: The Price-Performance Benchmark
Mono PERC, Monocrystalline Passivated Emitter Rear Contact, has been the dominant solar cell technology in India since roughly 2019. It adds a dielectric passivation layer to the rear of a monocrystalline silicon cell, reflecting unabsorbed photons back into the silicon for a second conversion attempt and reducing rear-surface electron recombination.
Efficiency range and typical output
Mono PERC commercial modules available in India in 2026 deliver 19–22% efficiency at STC. Most volume-tier products from ALMM-listed manufacturers cluster at 20–21%. Premium half-cut multi-busbar Mono PERC modules from Adani Solar, Waaree, and Vikram Solar reach the 21–22% bracket.
For a 5 kW rooftop in Ahmedabad with 5.5 peak sun hours per day:
- A 20% efficient Mono PERC system generates approximately 7,000–7,400 kWh per year in year one
- At Gujarat tariffs of ₹5–6/kWh, that is ₹35,000–₹44,400 in annual savings
Temperature coefficient: the Indian summer penalty
The temperature coefficient for Mono PERC panels is typically −0.34% to −0.37%/°C (referenced to the STC baseline of 25 °C). In Rajasthan in May, cell temperatures hit 70 °C. At −0.35%/°C, that 45 °C above STC means:
Loss = 45 × 0.35% = 15.75% of rated output on the hottest days.
A 400W Mono PERC panel may therefore produce only 337W on a peak summer afternoon despite strong irradiance. Across the full year, accounting for monsoon months, mild seasons, and hot summers, the annual temperature loss for Mono PERC in Indian conditions averages 8–12% of rated capacity.
Why Mono PERC is still the price-performance sweet spot
Despite TOPCon’s efficiency advantage, Mono PERC remains the default choice for a large segment of the Indian rooftop market because:
- Lower upfront cost: ₹20–23/Wp vs ₹22–26/Wp for TOPCon (MNRE benchmark, 2026)
- Wide ALMM availability: all major domestic manufacturers produce ALMM-listed Mono PERC, making it eligible for PM Suryaghar and KUSUM subsidies
- Mature supply chain: spares, replacements, and EPC familiarity are broadly available across Tier-2 and Tier-3 cities
- Adequate for most roofs: when roof area is not severely constrained and the buyer’s priority is minimising payback period, Mono PERC delivers strong ROI
The decision between Mono PERC and TOPCon depends heavily on your specific roof area, local irradiance profile, and whether you are optimising for lowest upfront cost or maximum lifetime generation. Our detailed analysis is in the solar panel cost breakdown.
TOPCon Efficiency: Better Low-Light and Temperature Performance
TOPCon, Tunnel Oxide Passivated Contact, represents the next generation of solar cell architecture. It adds a thin tunnel oxide layer and a doped polysilicon layer on the rear of the cell, which dramatically reduces surface recombination and enables higher open-circuit voltage and better carrier collection efficiency.
Efficiency range and what it means in practice
TOPCon commercial modules deliver 21–24% efficiency at STC. In volume production, most Indian-market TOPCon modules in 2026 hit 21.5–22.5%. Leading products from Tata Power Solar, Jinko Solar, and Longi reach 22.5–23.5%.
For the same 5 kW system in Ahmedabad, a 22% efficient TOPCon system generates approximately 7,400–7,900 kWh per year in year one, about 5–7% more than a comparable Mono PERC system of the same rated capacity.
Superior temperature coefficient
TOPCon’s real advantage in India is its lower temperature coefficient: −0.28% to −0.32%/°C, compared to −0.34% to −0.37%/°C for Mono PERC. Using the same Rajasthan summer example (cell temperature 70 °C):
- Mono PERC loss: 45 × 0.35% = 15.75%
- TOPCon loss: 45 × 0.30% = 13.5%
That 2.25% reduction in temperature loss, accumulated across every hot afternoon for 25 years, adds up to thousands of kilowatt-hours in a Gujarat or Rajasthan installation.
Better low-light performance
TOPCon panels also outperform Mono PERC under diffuse irradiance conditions, overcast days, morning and evening generation windows, and monsoon-season haze. The improved carrier collection in N-type TOPCon cells means the panel’s efficiency curve drops less steeply as irradiance falls from 1,000 W/m² to 200–400 W/m².
For Indian rooftops that receive significant diffuse irradiance during the four-month monsoon season, this low-light advantage can add 3–5% to annual generation versus what a pure STC efficiency comparison would predict.
Lower degradation rate
Mono PERC degrades at approximately 0.50–0.55% per year after the first year. TOPCon degrades at 0.40–0.45% per year (IEC 61215 accelerated test data, pvmagazine.com, 2025). Over 25 years, that 0.1% annual difference compounds to a roughly 2.5% higher output in year 25, and means the 25-year cumulative generation of a TOPCon system is meaningfully higher than an equivalently-rated Mono PERC array.
See our solar panel warranty explained guide for how to read power warranty terms and verify degradation guarantees in a contract.
HJT Efficiency: Premium Performance for Premium Installations
HJT, Heterojunction Technology, is the highest-performing mainstream solar cell architecture available in 2026. It combines a thin-film amorphous silicon layer on both sides of a monocrystalline N-type silicon wafer, creating a heterostructure that enables very high open-circuit voltage and exceptionally low recombination.
Efficiency range
HJT commercial modules deliver 23–25% efficiency at STC. In 2026, leading HJT products from REC Group, Panasonic HIT descendants, and Chinese manufacturers like Huasun reach 24–25%. Indian-market HJT is primarily available through import, with pricing at ₹28–35/Wp.
The best temperature coefficient of any commercial technology
HJT’s defining advantage in India is its temperature coefficient of −0.24% to −0.26%/°C: the lowest of any commercial silicon module. Using the same 70 °C cell temperature example:
- HJT loss: 45 × 0.25% = 11.25%
- vs Mono PERC at 15.75%
- vs TOPCon at 13.5%
HJT effectively retains 4.5% more output than Mono PERC on a hot Indian afternoon. In a location like Jodhpur or Ahmedabad, where cell temperatures exceed 65 °C for 60–90 days per year, this compounds into a substantial real-world advantage.
Where HJT makes sense
The HJT price premium (35–50% above Mono PERC) only justifies itself in specific scenarios:
- Space-constrained premium rooftops where every square metre of generation matters, heritage buildings, penthouse installations, BIPV
- High-tariff commercial installations where C&I electricity costs exceed ₹8/kWh and the extra generation pays back faster
- Installations in extreme heat zones: Rajasthan, Gujarat deserts, Tamil Nadu industrial rooftops, where the temperature coefficient advantage delivers maximum benefit
- Buyers prioritising 30-year longevity: HJT’s lower degradation rate (0.25–0.30%/year) means year-25 output stays above 93% of rated, vs ~87% for Mono PERC
For most residential and SME rooftops in India, TOPCon represents a better value proposition. HJT is the right call when roof space is genuinely scarce or when the installation is in an environment that stresses panels with sustained high temperatures.
Technology Comparison: Mono PERC vs TOPCon vs HJT
The table below compares all three technologies across every dimension that matters to an Indian buyer in 2026. Data sources: IEC 61215 test reports, MNRE benchmark pricing, pvmagazine.com module database, IEA PVPS 2025 annual report (iea.org), and Heaven Green Energy procurement data.
| Dimension | Mono PERC | TOPCon | HJT |
|---|---|---|---|
| Efficiency at STC | 19–22% | 21–24% | 23–25% |
| Typical market efficiency (2026) | 20–21% | 21–22.5% | 23–24% |
| Temperature coefficient (Pmax) | −0.34 to −0.37%/°C | −0.28 to −0.32%/°C | −0.24 to −0.26%/°C |
| Annual degradation (post yr-1) | 0.50–0.55% | 0.40–0.45% | 0.25–0.30% |
| Year-25 output (% of rated) | ~86–87% | ~88–90% | ~92–93% |
| Low-light performance | Good | Very good | Excellent |
| Bifacial availability | Yes | Yes | Yes |
| Cell type | P-type mono | N-type mono | N-type mono |
| LID susceptibility | Moderate | Low | Very low |
| Price per Wp (India, 2026) | ₹20–23 | ₹22–26 | ₹28–35 |
| ALMM-listed Indian brands | Adani, Waaree, Vikram, Tata | Tata, Waaree (N-type) | Limited (imports) |
| Best suited for | Budget homes, Tier-2 cities, PM Suryaghar | Homes, SME, C&I ≤ 100 kW | Premium, space-constrained, high-heat zones |
| IEC 61215 certified | Yes | Yes | Yes |
Efficiency vs cost: which panel gives best value?
| Scenario | Best choice | Reason |
|---|---|---|
| 3–5 kW residential, budget-conscious | Mono PERC 400–440W | Lowest upfront, strong ROI at typical tariffs |
| 5–10 kW residential, medium budget | TOPCon 540W | ₹2–3/Wp premium paid back in 2–3 years of extra generation |
| 10–100 kW commercial, Gujarat/Rajasthan | TOPCon 540–580W | Temperature coefficient advantage worth ₹60,000–₹80,000 over 25 yr |
| Premium residential, limited roof | HJT 420–500W | Maximum kW from limited area despite higher CAPEX |
| Industrial ≥ 100 kW, extreme heat | HJT or TOPCon bifacial | Temp coefficient + rear-side gain maximise plant PR |
| PM Suryaghar subsidy project | Mono PERC or TOPCon | Both ALMM-listed; TOPCon preferred for long-term yield |
Temperature Coefficient: How Indian Summers Cut Real-World Efficiency
The temperature coefficient is one of the most important numbers on a panel datasheet that Indian buyers routinely ignore. It tells you how much panel output drops for every degree Celsius the cell temperature rises above the STC reference of 25 °C.
Reading the datasheet
On any panel datasheet, look for:
- Pmax temperature coefficient: the most important figure; typically −0.30 to −0.37%/°C
- Voc temperature coefficient: always negative; −0.25 to −0.32%/°C
- Isc temperature coefficient: slightly positive; +0.04 to +0.06%/°C
The Pmax coefficient drives your real-world generation loss. A panel rated at −0.35%/°C will lose 0.35% of its rated output for every degree the cell is above 25 °C.
Calculating the Indian summer penalty
Indian rooftops experience:
- Ambient temperature: 35–45 °C in peak summer
- Panel surface temperature: typically ambient + 20–30 °C due to solar heating
- Cell temperature range: 55–75 °C during peak sun hours in April–June
At a cell temperature of 65 °C (conservative estimate for a well-ventilated rooftop):
| Technology | Temp coefficient | Loss at 65 °C cell temp | Effective output from 540W panel |
|---|---|---|---|
| Mono PERC | −0.35%/°C | −14.0% | 464W |
| TOPCon | −0.30%/°C | −12.0% | 475W |
| HJT | −0.25%/°C | −10.0% | 486W |
The HJT panel delivers 22W more than the Mono PERC panel from the same rated 540W at this temperature. Across a 10 kW system with 19 panels, that is 418W of additional real-world output on a hot afternoon, roughly half an extra panel’s worth of generation, at no additional roof space cost.
Strategies to reduce temperature losses in India
- Choose panels with lower temperature coefficient: TOPCon or HJT always beats Mono PERC in this regard
- Ensure adequate airflow under panels: a 100–150 mm gap between panel rear and roof surface can reduce cell temperature by 5–8 °C
- Avoid south-facing flat-roof installations on metal or asphalt surfaces: heat reflection from these surfaces raises cell temperatures further
- Use bifacial glass-glass panels where possible: the glass rear dissipates heat more effectively than polymer backsheets
For a comprehensive guide to maintaining panel performance year-round, see our solar panel maintenance for maximum efficiency guide.
Important: Temperature Loss Is Invisible on Your Quote
Most installer proposals show generation estimates based on STC wattage, not on real-world cell temperatures. A proposal showing 7,500 kWh/year from a 5 kW Mono PERC system may actually deliver 6,600–6,900 kWh once temperature derating is applied. Always ask for the generation estimate at NOCT, not just STC. Heaven Green Energy provides all estimates at both STC and at local NOCT-adjusted conditions.
Bifacial Panels and Rear-Side Efficiency Gain in India
Bifacial solar panels, available in both TOPCon and HJT formats, capture sunlight from both the front and rear of the panel. The rear side absorbs albedo (reflected) light from the ground or rooftop surface beneath the panel, adding 5–25% extra generation depending on the surface reflectivity and installation geometry.
How rear-side gain works
A bifacial panel uses a transparent rear, either a dual-glass construction or a transparent fluoropolymer backsheet, that allows light reflected from below to reach the back of the cells. The bifacial gain is expressed as:
Bifacial gain (%) = (Rear-side output ÷ Front-side output) × 100
Typical bifacial gains in field conditions:
- White reflective rooftop surface (gravel, white paint): 10–15% extra generation
- Light grey concrete: 5–8% extra
- Dark asphalt or black metal sheet: 2–4% extra
- Green grass or brown soil (ground mount): 8–12% extra
Indian conditions for bifacial
India’s ground-mounted solar parks on white-sand or high-albedo desert terrain in Rajasthan and Gujarat are ideal for bifacial. MNRE data shows bifacial gain of 8–12% in utility-scale installations in these states. For rooftop applications, the gain depends heavily on rooftop surface. A freshly painted white terrace in Surat can deliver 10–12% bifacial gain; a dark RCC terrace in Mumbai delivers 3–5%.
Bifacial TOPCon panels are the dominant choice for new C&I and utility-scale installations in India in 2026. The combination of TOPCon’s high efficiency, low temperature coefficient, and bifacial rear-side gain makes them the highest-performing commercially mainstream panel configuration available.
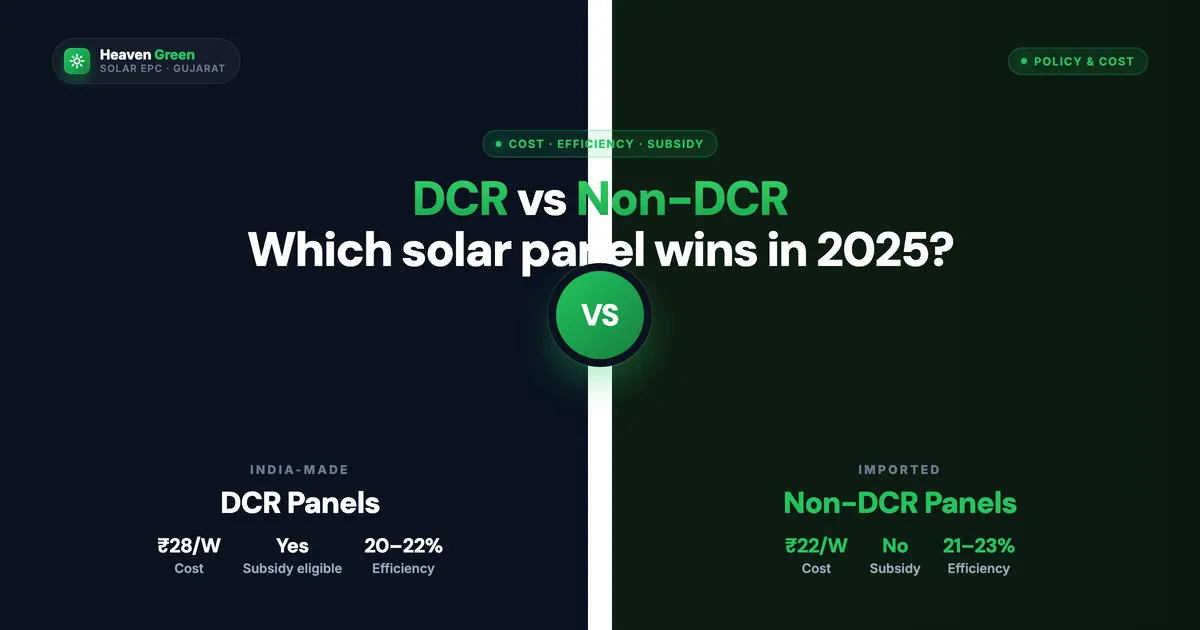
The DCR vs non-DCR solar panels guide covers which panel types qualify under domestic content requirement rules, important if you are evaluating bifacial imports vs domestically manufactured bifacial modules.
The Real-Output Rule: Heaven Green Energy’s Framework for Honest Estimates
Most solar proposals use oversimplified generation estimates that overstate what your system will actually deliver. We developed the Real-Output Rule to give customers a grounded, honest forecast that accounts for every major loss factor in Indian rooftop conditions.
The formula
Annual kWh = Rated kWp × Efficiency factor × Peak sun hours/day × (1 − Temperature loss%) × (1 − System loss%) × 365
Where:
- Rated kWp = system’s nameplate capacity (e.g., 5 kWp)
- Efficiency factor = panel efficiency as a decimal (e.g., 0.21 for 21%)
- Peak sun hours/day = location-specific average (Gujarat: 5.5, Rajasthan: 6.0, Maharashtra: 5.0)
- Temperature loss% = annual average loss from temperature derating (Mono PERC: 10%, TOPCon: 8%, HJT: 6.5%)
- System loss% = combined inverter, wiring, mismatch, soiling losses (typically 12–15%)
- 365 = days per year
Working example: 5 kWp TOPCon system in Ahmedabad
- Rated kWp: 5
- Efficiency factor: 0.215 (21.5% TOPCon)
- Peak sun hours: 5.5
- Temperature loss: 8%
- System loss: 13%
Annual kWh = 5 × 0.215 × 5.5 × (1 − 0.08) × (1 − 0.13) × 365 = 5 × 0.215 × 5.5 × 0.92 × 0.87 × 365 = 1,730 kWh/year per kWp = 8,650 kWh total for 5 kWp
A simple STC-based estimate for the same system would show 5 × 5.5 × 365 = 10,037 kWh, 16% higher than the real-output estimate. That 1,387 kWh gap represents the difference between an accurate proposal and an inflated one.
Step-by-step: how to calculate your own real-world output
- Find your panel’s efficiency on the datasheet (look for “Module Efficiency” at STC)
- Get your location’s peak sun hours from the MNRE Solar Radiation Resource Atlas or our solar calculator
- Note the temperature coefficient (Pmax) from the datasheet
- Estimate annual average cell temperature for your location (Gujarat: 48–52 °C average over the year; Rajasthan: 50–55 °C; Maharashtra coast: 44–48 °C)
- Calculate temperature loss: (avg cell temp − 25) × |temp coefficient| = annual avg temperature loss %
- Add system losses: assume 12–15% for a well-designed string inverter system
- Apply the Real-Output Rule formula above
- Cross-check against your installer’s estimate: if their figure is more than 10% higher than yours, ask them to walk you through their assumptions
Use Our Solar Calculator
Skip the manual calculation. Our solar calculator applies the Real-Output Rule with location-specific irradiance data, your panel technology choice, and live DISCOM tariff rates to give you an accurate generation and savings estimate in under 60 seconds.
How to Compare Solar Quotes Using Efficiency
Once you understand efficiency, you can use it to evaluate competing quotes in a way most buyers never do. Here is the practical methodology we teach our customers.
Same kWp, fewer panels = smaller roof footprint
Two installers may both quote you “5 kW.” Installer A uses thirteen 400W panels at 20% efficiency. Installer B uses ten 540W panels at 21% efficiency. On the face of it, both deliver 5 kW. But:
- Installer A needs 13 mounting structures, 13 sets of MC4 connectors, and 13 sets of junction box connections
- Installer B needs only 10 of each, roughly 23% fewer mechanical and electrical connections
- Fewer connections mean fewer potential failure points and lower long-term maintenance cost
Over 25 years, those three fewer panels’ worth of connections translate to lower probability of failure and typically lower solar panel maintenance costs.
The generation-per-rupee metric
When comparing quotes, calculate:
Generation per rupee = Estimated year-1 kWh ÷ Total system cost (₹)
A 5 kW Mono PERC system at ₹2,00,000 generating 7,200 kWh/year delivers 0.036 kWh per rupee. A 5 kW TOPCon system at ₹2,20,000 generating 7,700 kWh/year delivers 0.035 kWh per rupee. In this comparison, Mono PERC wins on year-1 value, but TOPCon’s lower degradation means it overtakes Mono PERC in generation-per-rupee over a 4–5 year horizon.
Extend the calculation to 25 years and TOPCon typically wins by ₹40,000–₹80,000 in cumulative net savings for a 5 kWp system in Gujarat conditions.
What to ask every installer
Before accepting a quote, demand these five data points in writing:
- Panel model number and datasheet: not just brand and wattage
- Module efficiency at STC (%)
- Temperature coefficient Pmax (%/°C)
- Year-1 estimated generation and the methodology used
- Year-25 warranted output as % of rated power
If an installer cannot provide these five numbers, you should treat their quote with significant caution. A credible EPC contractor will supply all five without hesitation. Our questions to ask solar installer framework covers the full evaluation checklist.
Efficiency and roof footprint: worked examples
| System size | Technology | Panel wattage | No. of panels | Approx roof area needed |
|---|---|---|---|---|
| 3 kWp | Mono PERC 20% | 415W | 8 panels | ~15 m² |
| 3 kWp | TOPCon 21.5% | 415W | 8 panels | ~14 m² |
| 3 kWp | HJT 23.5% | 415W | 8 panels | ~12.5 m² |
| 5 kWp | Mono PERC 20% | 415W | 13 panels | ~24 m² |
| 5 kWp | TOPCon 21.5% | 540W | 10 panels | ~26 m² |
| 5 kWp | HJT 24% | 430W | 12 panels | ~21 m² |
For a residential solar installation where roof area is constrained, HJT’s smaller physical footprint per kWp can be decisive.
High-Efficiency Premium Panels vs Standard-Efficiency Budget Panels: Pros and Cons
- + Higher kWh output per m² of roof, fits more capacity on limited space
- + Better temperature performance, critical for Indian summer months
- + Lower annual degradation adds 5–8% lifetime generation versus PERC
- + Superior low-light performance during monsoon and hazy conditions
- + Fewer panels for same kWp, lower BOS cost, fewer connections to fail
- + Higher year-25 warranted output (HJT: 92–93% vs PERC: 86–87%)
- − Higher upfront cost, ₹2–3/Wp premium for TOPCon; ₹6–12/Wp for HJT
- − HJT not widely ALMM-listed, may exclude PM Suryaghar subsidy eligibility
- − Larger physical format (540W+) needs wider mounting rails and careful structural check
- − Longer payback on premium if electricity tariffs are low
- − Fewer replacement SKUs available in remote cities, sourcing can take longer
- + Lowest upfront cost, best for tight budgets and short payback requirements
- + Widest ALMM availability, easy PM Suryaghar subsidy compliance
- + Mature, well-understood technology, EPC and O&M familiarity everywhere
- + Strong ROI when roof area is not a constraint
- − Higher temperature losses in Indian summers, more generation lost on hottest days
- − Higher annual degradation, year-25 output ~86–87% vs 92–93% for HJT
- − Lower low-light performance during monsoon months
- − More panels for same kWp, more mounting structures and connections
How Heaven Green Energy Selects Panels
At Heaven Green Energy, we do not pick panels by catalogue, we match the right technology to each site based on a structured evaluation. With over 10,000 installations across Gujarat, Maharashtra, and Rajasthan, we have field performance data on every major panel technology in Indian conditions.
Our panel selection process
Step 1, Site thermal assessment. Before recommending a technology, our engineers review historical ambient temperature data for your district and estimate expected cell temperatures based on your roof type, orientation, and ventilation. This determines whether Mono PERC, TOPCon, or HJT is warranted.
Step 2, Roof area audit. We measure usable shadow-free area after setbacks, water tanks, AC units, and aesthetic constraints. If usable area is below 1 m² per 100W of target capacity, we push toward higher-efficiency TOPCon or HJT. If area is generous, Mono PERC often wins on economics.
Step 3, Subsidy compatibility check. We verify ALMM listing for every panel we specify. For PM Suryaghar, KUSUM, and DISCOM empanelment projects, we only use ALMM-listed panels from the current MNRE list. See the ALMM guide for why this matters.
Step 4, Lifetime generation modelling. We run the Real-Output Rule calculation for each shortlisted panel, projecting 25-year cumulative generation and savings at your local DISCOM tariff. The panel with the best 25-year net savings, not just the lowest upfront cost, gets recommended.
Step 5, Warranty verification. We supply only panels with 12-year product warranty and 25-year linear power warranty from manufacturers with active Indian service presence. The solar panel warranty explained guide details exactly what to look for in a warranty document.
What we stock
We carry ALMM-listed panels from Adani Solar, Waaree Energies, Tata Power Solar, and Vikram Solar across Mono PERC and TOPCon formats, in wattages from 400W to 580W. For premium HJT projects, we source from REC Group and selected Indian manufacturers as availability develops. All panels come with BIS certification, IEC 61215 and IEC 61730 test reports, and ALMM listing documentation.
View the full datasheet comparison of panels we stock at /products/solar-modules. Ready to see which efficiency tier makes sense for your roof? Start with our solar calculator for a real-output estimate in under 60 seconds, or contact us for a free site assessment within 24 hours.
For large commercial or industrial projects where transformer selection interacts with panel configuration, see also our guide on transformer selection in solar power plants.
Frequently Asked Questions
What does solar panel efficiency mean?
Solar panel efficiency is the percentage of incoming sunlight that a panel converts into electricity. It is measured at Standard Test Conditions (STC): 1,000 W/m² irradiance, 25 °C cell temperature, AM 1.5 spectrum. A 21% efficient panel converts 210W of electricity from every 1,000W of sunlight striking each square metre of its surface. Higher efficiency means more electricity from the same roof area.
What is the efficiency of solar panels available in India in 2026?
In India in 2026, Mono PERC panels typically deliver 19–22% efficiency, TOPCon panels deliver 21–24%, and HJT panels deliver 23–25%. Most volume-tier products available through ALMM-listed manufacturers cluster at 20–21% for Mono PERC and 21–22.5% for TOPCon. HJT above 24% is available primarily through imports.
Why does efficiency matter more in India than in Europe?
India’s high ambient temperatures cause cell temperatures of 55–75 °C during summer months, far above the 25 °C STC reference. Every degree above 25 °C reduces panel output by 0.25–0.37% depending on technology. In European climates with milder summers, temperature losses average 5–8% annually. In India, they average 10–15%. This means the temperature coefficient, which is directly tied to cell technology and efficiency tier, matters more for Indian buyers than for buyers in cooler climates.
What is the difference in efficiency between Mono PERC, TOPCon, and HJT?
Mono PERC typically delivers 19–22% efficiency with a temperature coefficient of −0.34 to −0.37%/°C. TOPCon delivers 21–24% efficiency with a temperature coefficient of −0.28 to −0.32%/°C. HJT delivers 23–25% efficiency with a temperature coefficient of −0.24 to −0.26%/°C. In real Indian summer conditions, TOPCon retains about 1.5–2.5% more output than Mono PERC, and HJT retains about 3.5–5% more output than Mono PERC, relative to rated capacity.
Does higher efficiency mean faster payback period?
Not automatically. Higher efficiency panels usually cost more per Wp, which can extend the payback period if the efficiency gain is not large enough to compensate. For Indian rooftops, TOPCon typically pays back its premium over Mono PERC within 2–3 years of extra generation. HJT’s premium is larger and pays back in 4–7 years depending on local tariff and temperature conditions. Our solar calculator can model payback for your specific scenario.
What is STC and why does it not reflect real Indian conditions?
STC stands for Standard Test Conditions, the controlled lab environment (1,000 W/m² irradiance, 25 °C cell temperature) used to rate solar panels globally under IEC 61215. In India, cell temperatures average 45–60 °C over the year and peak at 65–75 °C in summer. Since every degree above 25 °C reduces output, Indian real-world generation is always lower than STC-rated figures. NOCT (Nominal Operating Cell Temperature) tests at 800 W/m² and 20 °C ambient give a more realistic intermediate reference, but the Real-Output Rule formula provides the most accurate projection for Indian conditions.
How do I check if a solar panel is BIS-certified and ALMM-listed?
BIS certification can be verified at bis.gov.in by searching for the panel brand and model under IS 14286 (India’s national standard equivalent to IEC 61215 and IEC 61730). ALMM listing can be verified at mnre.gov.in under the ALMM section. Both verifications require the exact panel model number, which your installer should provide. ALMM listing is mandatory for panels used in PM Suryaghar and other government subsidy schemes.
What efficiency should I look for when buying solar panels in India?
For a residential rooftop in 2026, target at least 20% efficiency for Mono PERC and 21% for TOPCon. Below these thresholds, you are likely buying older or lower-quality cells. Efficiency alone is not sufficient, also check temperature coefficient (should be below −0.35%/°C for Mono PERC, below −0.31%/°C for TOPCon), degradation warranty, and ALMM listing. Our how to choose solar modules guide covers the complete evaluation criteria.