Group captive solar is the structure most large Indian factories now use to cut electricity bills without buying the plant outright. Under the Electricity Rules 2005, Rule 3, a group captive plant is a solar park where consumers collectively hold at least 26% equity and consume at least 51% of the annual generation. Get those two thresholds right and you legally side-step the Cross Subsidy Surcharge (CSS) that hits regular open access (OA) buyers, pulling landed tariffs down to ₹4–5/kWh against a DISCOM grid rate of ₹8–10/kWh. The 2023 Electricity Amendment Rules tightened verification but kept the core ratio untouched, so 2026 is a settled, predictable year to commit.
This guide walks through the 5-Stage Group Captive Setup Path Heaven Green Energy uses across Gujarat, Maharashtra, Tamil Nadu, Karnataka, and Madhya Pradesh, including the SPV (Special Purpose Vehicle) formation rules, the share-purchase math, the open access charge map by state, and where group captive beats CAPEX, OPEX, and IPP (Independent Power Producer) structures on landed cost.
Direct answer. Group captive solar lets industrial consumers buy ≥26% equity in a dedicated solar SPV and consume ≥51% of its annual generation, under Electricity Rules 2005. The structure waives Cross Subsidy Surcharge (CSS) and trims wheeling charges, pulling landed tariffs to ₹4–5/kWh against a ₹8–10/kWh grid rate, typical net savings of ₹2–3/kWh over 25 years for textile mills, ceramic clusters, IT parks, and multi-site SMEs.
If you’re an HT industrial consumer with a monthly bill above ₹40 lakh and no rooftop or land of your own, group captive is almost always the cheapest legitimate path. The trade-off is upfront equity, a 12–18 month setup window, and ongoing compliance, all manageable with the right SPV partner.
What Group Captive Means Under Electricity Rules 2005
The Ministry of Power’s Electricity Rules 2005, Rule 3, draws a clean line between three structures: regular open access, captive, and group captive. Each has a different cost stack because each is treated differently by the State Electricity Regulatory Commission (SERC) on the surcharge front.
- Regular open access: consumer buys solar power from a third-party generator over the DISCOM grid. Pays full Cross Subsidy Surcharge, additional surcharge, wheeling, transmission, and banking charges. Landed cost typically ₹5.5–7/kWh.
- Single captive: one consumer owns 100% of the generating asset and consumes 100% of generation. No CSS. Used by very large standalone plants (steel, cement). Landed cost ₹3.5–4.5/kWh.
- Group captive: multiple consumers form an SPV, each holding ≥26% equity (proportionate to their offtake), with collective consumption ≥51% of annual generation. CSS waived, wheeling reduced. Landed cost ₹4–5/kWh.
The 2023 amendment to the Electricity Rules clarified that the 26% and 51% tests are checked on a financial-year basis against the SPV’s audited shareholder pattern and metered consumption data, both filed annually with the SERC and the Central Electricity Authority (CEA). Miss either threshold in a year and that year’s CSS becomes payable retrospectively. This is the single biggest risk to manage, and it is why the SPV structure matters more than the panels themselves.
The 5-Stage Group Captive Setup Path
This is the framework Heaven Green Energy applies on every group captive engagement, five sequential stages with discrete deliverables. The end-to-end window runs 12–18 months from feasibility to first unit exported.
Stage 1: Feasibility & Member Anchoring (Month 1–3)
Before any SPV paperwork, the project needs an anchor consumer, usually a single industrial buyer with ≥20% of the total offtake. Heaven Green runs a feasibility study covering:
- Annual electricity demand of each prospective member (kWh and load profile).
- Connected DISCOM and HT tariff slab, including current CSS, wheeling, and additional surcharge.
- Site shortlist for the solar park (5–30 MW typical, requiring 25–150 acres).
- Power evacuation point at the nearest 33 kV / 66 kV / 132 kV substation.
- Indicative landed tariff after CSS waiver and wheeling.
The output is a member-by-member savings sheet, without ₹2–3/kWh of indicated savings, the structure rarely justifies its overheads.
Stage 2: SPV Formation & Regulatory Filings (Month 3–5)
The SPV is incorporated as a private limited company under the Companies Act 2013, with each consumer subscribing to equity in proportion to their planned offtake. Filings include:
- Registrar of Companies (ROC) incorporation with Memorandum and Articles drafted for power generation.
- Shareholder agreement specifying the 26%/51% covenants, exit terms, and dilution triggers.
- Open access application with the State Load Despatch Centre (SLDC) and SERC.
- Land lease or purchase, with conversion to non-agricultural use where applicable.
Stage 3: Member Onboarding & Consumption Sizing (Month 4–7)
Each member signs a Power Purchase Agreement (PPA) with the SPV, usually 20–25 years, and a Share Subscription Agreement locking the 26% minimum. Consumption is sized so the collective demand from members holding equity is ≥51% of expected generation; the residual can be sold to non-equity consumers as regular open access, but that share carries CSS and is treated as a separate revenue stream.
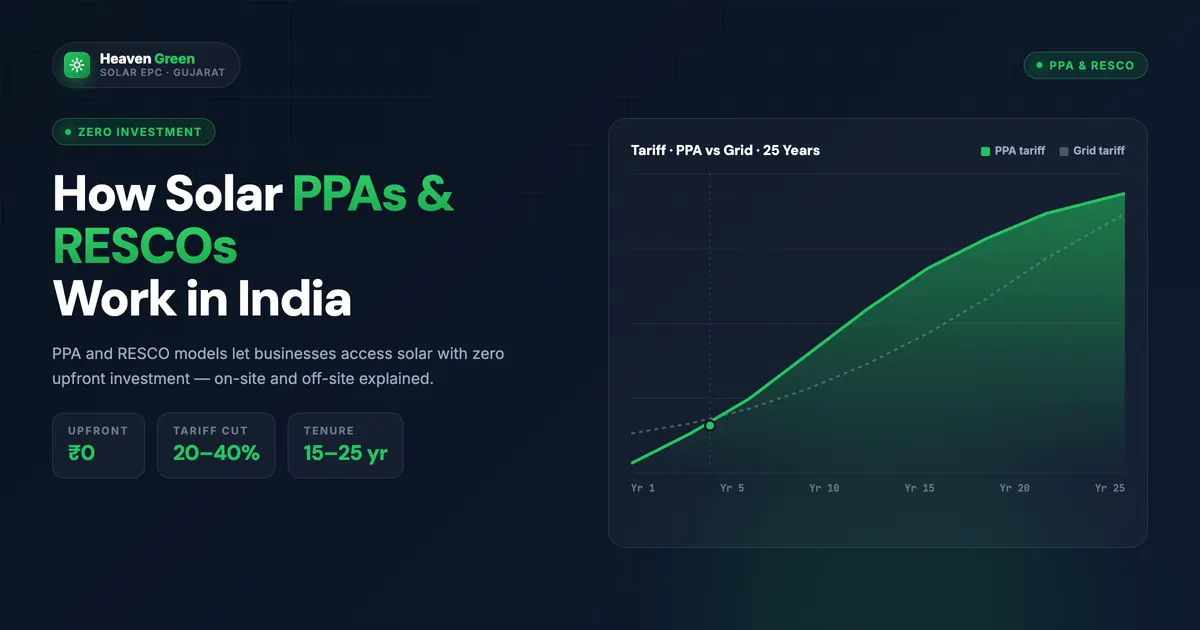
For a deeper view on how PPAs are negotiated under similar structures, see our how solar PPAs and RESCOs work in India guide.
Stage 4: Equity Funding & EPC Award (Month 6–10)
Member equity is called in tranches against capex milestones. Typical financing stack for a 20 MW group captive park:
- Member equity (26–30% of project cost), paid in by consumers.
- Sponsor equity (10–15%), from the developer.
- Senior debt (55–60%), from IREDA, SBI, or PFC at 8.5–9.5%.
The Engineering, Procurement and Construction (EPC) contract is awarded against fixed CAPEX and a 25-year performance guarantee. Heaven Green’s solar EPC services handle ground-mount parks across this MW range; for utility-scale builds see our ground mount solar park page.
Stage 5: Commissioning, Banking & Compliance (Month 10–18)
Commissioning involves the Chief Electrical Inspectorate (CEI) clearance, SLDC scheduling registration, and grid-synchronisation tests. Banking arrangements are signed with the DISCOM, 100% of generation can typically be banked monthly, with a 10–15% banking charge in kind. Compliance becomes recurring:
- Annual filing of shareholder pattern with SERC and CEA.
- Audited consumption certificate proving ≥51% collective offtake.
- Quarterly energy accounting with SLDC.
26% Equity + 51% Consumption Rule Explained
The two thresholds are easy to state and trickier to engineer. Here’s how the math actually works for a 20 MW solar park generating ~36 million kWh annually, with three members.
| Member | Annual demand (kWh) | Share of total offtake | Equity required | Equity value (₹ Cr) |
|---|---|---|---|---|
| Anchor textile mill | 14.5 million | 40% | 40% (≥ 26%) | 28.0 |
| Ceramic cluster (4 units) | 11.0 million | 30% | 30% (≥ 26%) | 21.0 |
| Multi-site IT park | 11.0 million | 30% | 30% (≥ 26%) | 21.0 |
| Total members | 36.5 million | 100% | 100% | 70.0 (project cost ₹98 Cr) |
Project cost ≈ ₹98 Cr; member equity ≈ ₹70 Cr (~70% of project); the balance is sponsor equity plus senior debt. Each member’s equity stake mathematically exceeds 26% and collective consumption is 100% of generation, well past 51%.
The formula Heaven Green uses for each member:
Member equity (₹) = (Member’s planned offtake ÷ Total member offtake) × Total member equity pool
The 26% test must hold per member every financial year. If a textile mill cuts production and its actual consumption drops to 18% of total, even though its shareholding is 40%, the SERC reads consumption, not equity, as the binding test for the 51% collective threshold. Plan for ±15% demand variation by under-sizing the park slightly.
The 51% test is the harder one to engineer because it tracks actual metered consumption over the financial year. A common mistake is sizing the park to match peak member demand; in reality, plant shutdowns for maintenance, seasonal production cycles, and demand contraction during slowdowns can pull collective consumption below 51%. Heaven Green uses a 90–95% sizing rule, generation expected at 95% of the lowest forecast year of demand, so the 51% threshold has natural headroom even in a weak production year. The residual generation in strong years is sold as banked surplus or to non-equity buyers as regular open access.
A second subtle point: the rule reads as a collective test, not member-by-member. A member consuming below 51% of their entitled share doesn’t break the SPV’s captive status, as long as the collective consumption stays above 51% of total generation. This gives the SPV some flexibility, a weak performer in one year can be balanced by stronger offtake from another member. The shareholder agreement should include a “true-up” mechanism so a member who consistently under-consumes is either diluted or redirects supply to other members at a settlement price.
Tariff Savings Compared to Grid + OA Charges
Here is the all-in landed cost comparison for an HT industrial consumer in Gujarat, drawn against the Gujarat Electricity Regulatory Commission (GERC) FY26 tariff order.
| Cost component | DISCOM grid (HT) | Regular open access | Group captive |
|---|---|---|---|
| Energy charge | ₹7.20 | ₹3.40 | ₹3.40 |
| Cross Subsidy Surcharge (CSS) | , | ₹1.65 | ₹0 (waived) |
| Additional surcharge | , | ₹0.55 | ₹0.55 |
| Wheeling charge | included | ₹0.85 | ₹0.55 |
| Transmission charge | included | ₹0.40 | ₹0.40 |
| Banking charge (10–15% in kind) | , | ₹0.35 | ₹0.35 |
| Electricity duty | ₹0.85 | ₹0.85 | ₹0.85 |
| Landed cost (₹/kWh) | ₹8.05 | ₹8.05 | ₹6.10 |
The grid and regular OA land roughly the same, which is exactly why regular OA never became dominant in India. Group captive cuts ₹1.95/kWh in this Gujarat example. For higher-CSS states (Maharashtra, Karnataka), the savings widen to ₹2.5–3/kWh. For an HT mill consuming 36 million kWh annually, that’s ₹7–10 crore of recurring savings.
For a full structural comparison of finance models, including how CAPEX, OPEX, and group captive trade off, read our OPEX vs CAPEX guide for 2026.
Three line items deserve a closer look because they are the ones most often mis-estimated by first-time SPV members. Cross Subsidy Surcharge is set by the SERC and recalculated each year, the FY26 GERC number of ₹1.65/kWh is a snapshot, not a permanent figure. Always model with the latest tariff order, and stress-test the savings against a ±20% CSS movement.
Wheeling charges vary with voltage class. A consumer connected at 132 kV pays a lower wheeling charge than one at 33 kV because fewer transformation stages are involved. If your industrial estate is on 132 kV, the wheeling line in the table above can drop another ₹0.15/kWh.
Banking is the most under-appreciated cost. A 10–15% in-kind banking charge effectively means the DISCOM keeps that share of your banked surplus as a fee. For a park generating 36 million kWh, banking 30% of generation and losing 12% in kind costs the SPV ~1.3 million kWh/year, roughly ₹65 lakh at retail equivalents. Tight scheduling and demand-aligned generation profiles minimise this leakage.
Talk to our group captive team. We’ve structured group captive parks across Gujarat, Maharashtra, Tamil Nadu, Karnataka, and Madhya Pradesh, from anchor sizing through SPV formation to commissioning. Request a feasibility study →
Group Captive vs CAPEX vs OPEX vs IPP, Where Each Wins
Four structures dominate Indian commercial and industrial solar in 2026. Each fits a different balance-sheet position.
| Dimension | CAPEX (own) | OPEX (PPA) | Group Captive | IPP (third-party) |
|---|---|---|---|---|
| Ownership | 100% consumer | Developer | SPV (≥26% consumer equity) | Developer |
| Upfront cost | 100% project cost | ₹0 | 26–30% of project cost | ₹0 |
| Landed tariff | ₹2.5–3/kWh (post-AD) | ₹4–5.5/kWh | ₹4–5/kWh | ₹5.5–7/kWh |
| CSS exposure | None (rooftop) | None (rooftop OPEX) | Waived | Full CSS payable |
| Accelerated Depreciation benefit | Direct to consumer | Captured by developer | Pro-rated by equity share | Captured by developer |
| Tenure flexibility | Forever | 15–25 years | 20–25 years | 15–25 years |
| Best for | Cash-rich mid-size factory | Cash-light SME, rented roof | Multi-member large industrial | Light-asset consumer |
The decision tree is straightforward: if you own the roof or land and have surplus cash plus a profit position to absorb depreciation, CAPEX wins. If you have no land but want zero CAPEX, OPEX or IPP wins depending on tariff. If your consumption is large, your DISCOM CSS is high, and you can put up 26% equity, group captive wins by 15–20% on landed tariff over its life.
For a tax-driven CAPEX view, see our accelerated depreciation guide. For the rooftop OPEX comparison specifically, see OPEX vs CAPEX solar.
A simple rule of thumb our deal team uses with CFOs: if your monthly HT bill is under ₹10 lakh, run CAPEX rooftop on whatever roof you have, and ignore group captive. If it’s ₹10–40 lakh, run OPEX rooftop and supplement with group captive only if you have spare capital and predictable demand. Above ₹40 lakh a month, group captive becomes the dominant structure because the CSS savings alone, typically ₹50 lakh to ₹2 crore per year, comfortably justify the SPV setup costs and annual compliance overhead. The IPP route is the rarest in practice: it’s used by consumers who specifically want zero balance-sheet exposure and are happy to pay a 15–20% premium over group captive for that purity. Most listed Indian manufacturers don’t choose it; the savings difference is too large to ignore.
State-Wise Open Access Charge Exemptions
Each SERC sets its own open access framework, which means group captive economics vary state to state. The CSS waiver is uniform across India under central rules, but wheeling, additional surcharge, and banking treatment differ.
| State (Regulator) | CSS waiver under group captive | Wheeling charge | Banking allowance | Notes |
|---|---|---|---|---|
| Gujarat (GERC) | Yes, full | ₹0.55/kWh | 100% monthly, 10% in-kind | Most active group captive market |
| Maharashtra (MERC) | Yes, full | ₹1.10/kWh | 100% monthly, 12% in-kind | High CSS savings (~₹2/kWh) |
| Tamil Nadu (TNERC) | Yes, full | ₹0.65/kWh | 100% monthly, 14% in-kind | Strong industrial pipeline |
| Karnataka (KERC) | Yes, full | ₹0.80/kWh | 100% monthly, 12% in-kind | Bengaluru IT parks dominant |
| Madhya Pradesh (MPERC) | Yes, full | ₹0.45/kWh | 100% monthly, 10% in-kind | Lowest landed tariffs in this group |
| Rajasthan (RERC) | Yes, full | ₹0.50/kWh | 100% monthly, 10% in-kind | Strong irradiance, growing pipeline |
| Andhra Pradesh (APERC) | Conditional, CEEW filings | ₹0.85/kWh | 100% monthly, 12% in-kind | Recent disputes on retrospective CSS |
Tariff orders are revised annually; figures are FY25–FY26 indicative. For the master regulatory reference, the Central Electricity Regulatory Commission publishes the model regulations, while each SERC issues state-specific tariff orders, MERC and MNRE publish state-wise summaries used by most developers.
Gujarat remains the deepest market. GERC’s open access regulations are stable, land conversion timelines are reasonable, and the state’s industrial belt, Ahmedabad, Surat, Vadodara, Rajkot, generates enough demand to anchor multi-member parks; for the broader state incentive landscape beyond open access, see our Gujarat solar policy overview. Maharashtra is the highest-savings market because MERC’s CSS is among the steepest in India; a Pune textile cluster can save ₹2.5–3/kWh against MSEDCL grid.
Tamil Nadu has matured fast since TNERC’s revised open access regulations in 2024. Coimbatore textile mills and Hosur engineering plants are the dominant offtakers. Karnataka suits the IT and data-centre segment; KERC’s banking allowance is generous, and Bengaluru’s evening peak aligns well with banked surplus. Madhya Pradesh offers the lowest absolute landed tariffs due to low wheeling charges, but member pipelines are thinner, finding three or four well-rated anchors takes longer.
The state-wise picture is fluid. Tariff orders are typically issued in March-April; any group captive feasibility done in February must be re-run against the new order before equity is committed.
Common Mistakes Setting Up Group Captive
Five mistakes we see repeatedly, each one preventable in feasibility, painful to fix after commissioning.
-
1
Over-sizing the park relative to member demand. If members hold equity but cannot absorb 51% of generation in a given year, CSS becomes retrospectively payable for that year. Size at 90–95% of total member demand, not 110%.
-
2
Weak shareholder agreement on exit and dilution. If a member sells out and the new buyer falls below 26%, the SPV loses captive status. Lock pre-emption rights and minimum holding clauses in the SHA from day one.
-
3
Ignoring banking charge erosion. A 12–14% in-kind banking charge silently lifts landed cost by ₹0.30–0.40/kWh. Build it into the feasibility tariff, not the headline tariff.
-
4
Treating accelerated depreciation as a developer-only benefit. In a group captive SPV, AD flows through to equity holders pro-rata; members who can absorb it should claim it on their books, not leave it with the SPV.
-
5
Skipping annual compliance filings. The shareholder pattern certificate, consumption audit, and SLDC reconciliation must be filed every year. A missed filing triggers a SERC notice and, in some states, retrospective CSS demand.
For a member-side view of project economics, our solar ROI calculator guide walks through the IRR math that group captive members should run before signing the SHA.
Two more mistakes that don’t make the numbered list but cost members money every year. First, under-budgeting transmission losses. Power evacuated from a 25 MW park to a textile mill 80 km away loses 4–6% in transmission. If your feasibility tariff assumes a “delivered” generation figure, those losses are silently absorbed by the SPV; if it assumes generation at the busbar, the consumer absorbs them. Make sure the PPA and the financial model match.
Second, weak EPC performance guarantees. Group captive parks live or die on the Performance Ratio (PR) of the EPC build, a 78% PR vs a 75% PR delta on a 20 MW park is worth ₹2 crore a year. Lock the PR target at ≥77% in the EPC contract, with liquidated damages for underperformance, and tie a portion of the EPC payment to the first three years of generation data.
Group Captive vs Direct OPEX/PPA
For mid-sized consumers, those with 10–50 million kWh annual demand and no land of their own, the real choice is between joining a group captive SPV and signing an OPEX rooftop PPA. Here’s the honest balance.
- + Lowest legitimate landed tariff after CSS waiver
- + Equity gives upside if power tariffs rise
- + Accelerated depreciation pro-rated to members
- + Scales to 5–30 MW, works for very large loads
- + 20–25 year tariff lock with predictable escalation
- − 26% upfront equity ties up capital
- − 12–18 month setup window before first unit
- − Annual compliance burden (SERC, CEA, SLDC)
- − Exit complexity, share transfer needs board approval
- − Risk of retrospective CSS if 51% test missed
Verdict. Group captive is the strongest structure for industrial consumers spending ₹40 lakh+ a month on electricity, with stable demand, in a high-CSS state (Maharashtra, Karnataka, Gujarat). It is the wrong structure for small or volatile loads, those should stick to rooftop OPEX, which removes the 51% consumption risk and the compliance overhead. The break-even is roughly 8–10 million kWh annual demand; below that, the equity cost rarely justifies the savings.
For factories sitting in this break-even zone, our commercial solar page maps the OPEX rooftop alternative, and the industrial solar page covers blended structures combining rooftop and group captive shares.
The blended structure deserves a separate mention. A textile mill with 40,000 sqm of usable roof and 18 million kWh of annual demand can put 4 MW of rooftop solar (CAPEX or OPEX) on its own building, covering ~30% of demand, and join a group captive park for the remaining 60–70%. The rooftop share carries no CSS and no wheeling. The group captive share carries no CSS but pays wheeling and banking. The blended landed tariff is typically ₹0.30–0.50/kWh better than pure group captive and ₹0.80–1.20/kWh better than pure OPEX. This is the structure most large Indian manufacturers settle on after running all the comparisons.
How Heaven Green Energy Helps Set Up Group Captive
Heaven Green Energy has structured group captive solar parks across Gujarat, Maharashtra, Tamil Nadu, Karnataka, and Madhya Pradesh for textile, ceramic, IT, and MNC consumers. We handle the full path end-to-end so the consumer’s CFO and plant teams aren’t running three separate vendors for legal, EPC, and compliance.
- Feasibility & anchor sourcing: landed-tariff modelling against your DISCOM tariff order, with member-by-member savings sheets your board can sign off on.
- SPV formation: ROC incorporation, Memorandum drafting, shareholder agreement, share-subscription documents, and SERC open access filing.
- EPC delivery: utility-scale ground-mount construction from 5 MW to 30 MW with Tier-1 modules, central inverters, and 25-year performance guarantees.
- Banking & SLDC integration: banking arrangement with the DISCOM, SLDC scheduling registration, and metering reconciliation.
- Annual compliance: shareholder pattern filings, consumption audits, and SERC submissions kept on a managed-service basis.
Explore the services that match your structure:
- Commercial Solar: rooftop and ground-mount for 100 kW–5 MW consumers.
- Industrial Solar: group captive and OPEX blends for large HT loads.
- Solar EPC Services: turnkey EPC with 25-year O&M.
- Ground-Mount Solar Park: utility-scale park design and delivery.
- Contact us: for a feasibility quote tailored to your DISCOM and demand profile.
Most engagements start with a one-page demand and DISCOM brief from the consumer, last twelve months of HT bills, plant location, sanctioned load, and an indicative growth view. Within two weeks, our deal team returns a feasibility note showing landed tariff under each structure (CAPEX rooftop, OPEX rooftop, group captive, blend) for the next twenty-five years, with sensitivity tables on tariff escalation, CSS movement, and PR variance. From there, anchor sourcing and SPV formation are the longest stretches; EPC delivery sits inside our standard 6–9 month construction window for ground-mount parks up to 20 MW. The CFO-facing model and the plant-facing energy plan are kept in sync throughout, a discipline we’ve found makes the board sign-off considerably faster.
Frequently Asked Questions
What is group captive solar and how does it differ from regular open access?
Group captive solar is a power-generation structure under Electricity Rules 2005 where multiple industrial consumers form a Special Purpose Vehicle (SPV) to own a solar park collectively. Each consumer must hold at least 26% equity and the consumers must collectively consume at least 51% of the annual generation. Unlike regular open access, where consumers buy power third-party and pay Cross Subsidy Surcharge, group captive consumers are exempt from CSS, cutting landed tariff by ₹1.5–3/kWh depending on the state.
How much equity does each consumer need to hold in a group captive SPV?
Each consumer must hold a minimum of 26% equity in the SPV, sized in proportion to their planned annual electricity offtake. For a ₹98 crore, 20 MW project, a consumer taking 40% of the generation would subscribe to roughly 40% of the equity pool, about ₹28 crore. The 26% test is checked annually against the audited shareholder pattern filed with the SERC and CEA.
What savings can an industrial consumer expect from group captive solar in 2026?
Typical landed tariff under group captive is ₹4–5 per kWh, against HT industrial grid tariffs of ₹8–10 per kWh, net savings of ₹2–3 per kWh. For a textile mill consuming 14.5 million kWh annually, that translates to ₹3–4.5 crore of recurring savings. The savings widen in high-CSS states like Maharashtra and Karnataka, where the Cross Subsidy Surcharge alone is ₹1.5–2 per kWh.
How long does it take to set up a group captive solar project?
End-to-end setup runs 12–18 months from feasibility study to commissioning. Stage breakdown: feasibility and member anchoring (1–3 months), SPV formation and regulatory filings (2–3 months), member onboarding and Power Purchase Agreement signing (1–3 months), EPC award and construction (4–8 months), and commissioning with banking and SLDC integration (1–2 months). The construction window depends on park size and DISCOM evacuation readiness.
Which states are most active for group captive solar projects?
Gujarat, Maharashtra, Tamil Nadu, Karnataka, and Madhya Pradesh dominate group captive activity in 2026. Gujarat leads on volume because of GERC’s clean open access framework, low wheeling charges, and strong industrial demand. Maharashtra produces the highest CSS savings per kWh due to MERC’s tariff design. Karnataka attracts IT parks around Bengaluru. Madhya Pradesh offers the lowest absolute landed tariffs due to low wheeling charges.
What happens if a group captive member’s consumption drops below the required share?
If collective member consumption falls below 51% of annual generation in a given financial year, the SPV loses group captive status for that year and the CSS becomes retrospectively payable on offtaken units. This is the single largest risk in the structure. Heaven Green sizes parks at 90–95% of total member demand and writes minimum-offtake covenants into the Power Purchase Agreement to manage this risk.
Can a single consumer claim accelerated depreciation in a group captive structure?
Yes, accelerated depreciation flows through to equity holders pro-rata to their shareholding in the SPV. A consumer holding 30% equity can claim 30% of the depreciation benefit on their own books, provided they have the profit position to absorb it. This is a meaningful tax shield for profitable manufacturers and is one reason group captive remains attractive against pure OPEX, where the developer captures the full AD benefit.
Is group captive better than rooftop OPEX for industrial consumers?
It depends on demand size and balance-sheet position. For consumers with annual demand above 8–10 million kWh, stable consumption, and the equity headroom to commit 26% of project cost, group captive delivers a lower landed tariff and gives upside exposure to rising grid rates. For smaller or volatile loads, rooftop OPEX is the better fit, no equity, no 51% consumption risk, and no annual SERC compliance. Many of our clients run a blend: rooftop OPEX on factory roofs plus group captive equity for the residual baseload.