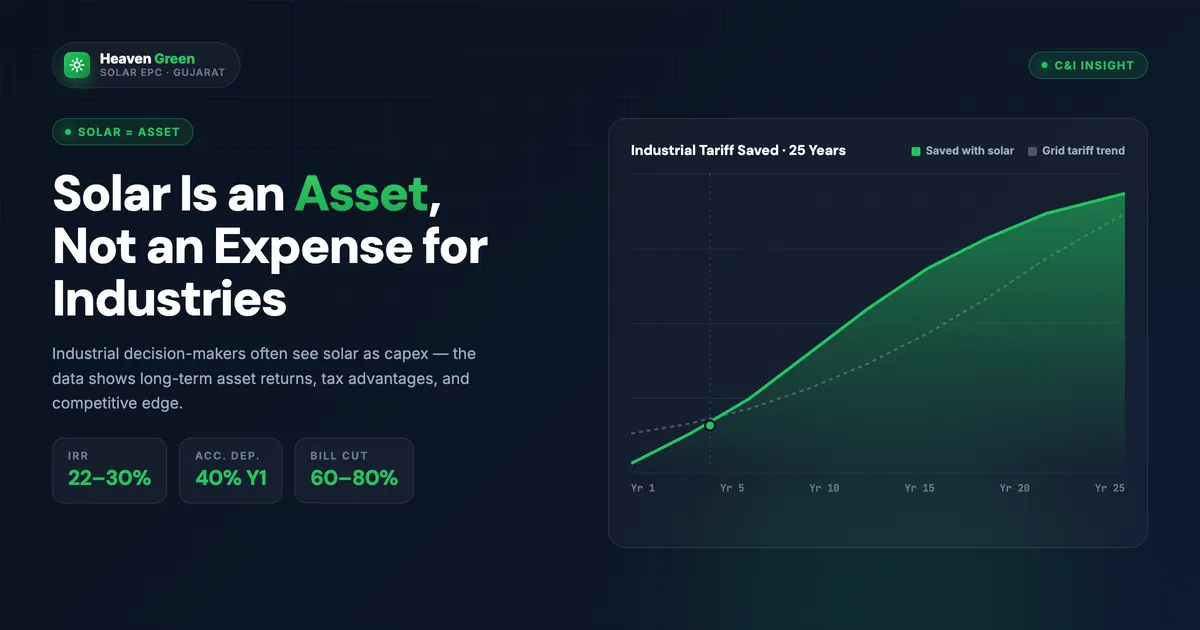
For commercial and industrial buyers evaluating solar in 2026, every conversation eventually narrows to a single decision: pay for the system upfront and own it, or sign a long-term electricity contract and let someone else own the hardware. That is the CAPEX vs OPEX choice, and in a year when grid tariffs for industrial High-Tension (HT) consumers sit between ₹8 and ₹12 per kWh, the model you choose changes the lifetime value of the project by 1.5–2x. CAPEX (Capital Expenditure) puts the asset on your balance sheet and unlocks Accelerated Depreciation (AD). OPEX, also called the Renewable Energy Service Company (RESCO) model or Power Purchase Agreement (PPA), keeps your cash but routes most of the value to the developer.
This 2026 update replaces our older OPEX vs CAPEX explainer with a sharper decision framework, fresh tariff data from the Ministry of New and Renewable Energy (MNRE), the Indian Renewable Energy Development Agency (IREDA), the Council on Energy, Environment and Water (CEEW), and Mercom India, plus two full financial scenarios (100 kW commercial and 1 MW industrial) and sector-by-sector verdicts for hospitals, textile units, IT offices, and factories.
Direct answer. CAPEX wins for tax-paying companies on owned property with stable load and a 5+ year horizon, typical post-AD payback is 3.5–4 years and lifetime Internal Rate of Return (IRR) crosses 22%. OPEX wins for cash-constrained buyers, leased premises, low-profit entities that cannot use AD, and hospitals or schools that need zero capex with day-one savings; PPA tariffs in 2026 sit at ₹4.50–5.00/kWh against grid rates of ₹8–10/kWh. If you tick three or more of the CAPEX criteria, own; otherwise, sign a well-negotiated PPA.
If your finance team has been going back and forth between the Chartered Accountant (CA) and the Chief Financial Officer (CFO) on which model to recommend to the board, the next 3,000 words give you everything needed to close the loop, including the named 6-Factor OPEX vs CAPEX Decision Matrix we use with Heaven Green Energy’s commercial clients in Gujarat, Maharashtra, and Rajasthan.
What CAPEX and OPEX Models Actually Mean for Solar
In corporate finance, CAPEX is spending that creates a long-lived asset on your balance sheet and depreciates over time. OPEX is a recurring expense that flows through the Profit & Loss (P&L) statement in the year it is incurred. Both definitions are codified in Indian Accounting Standards (Ind-AS) and the Companies Act, 2013. Applied to commercial solar in 2026, they translate into two very different commercial structures.
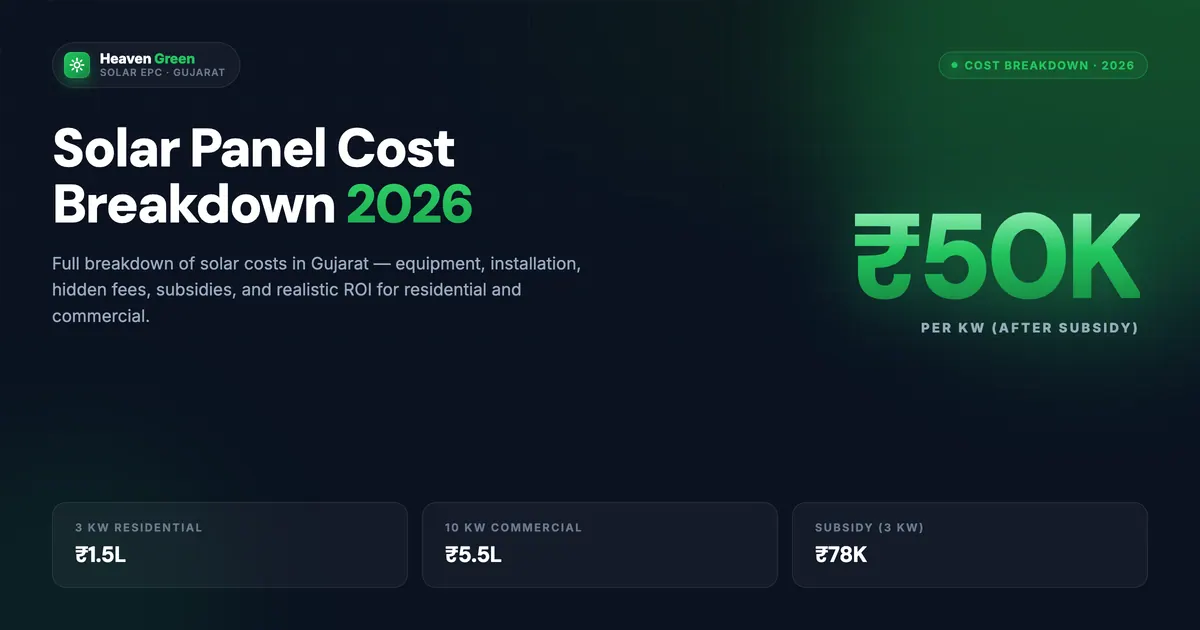
CAPEX model. Your company funds the entire system upfront, currently ₹38–₹50 per watt-peak (Wp) for utility-grade Commercial & Industrial (C&I) rooftop projects above 100 kW, including modules, inverters, mounting, cabling, net metering, and commissioning. You own the asset for its 25-year life, claim 40% Accelerated Depreciation under Section 32 of the Income Tax Act in Year 1 plus 20% on the Written Down Value (WDV) in subsequent years, capture 100% of electricity savings, and carry the Operations & Maintenance (O&M) responsibility either in-house or via an Annual Maintenance Contract (AMC).
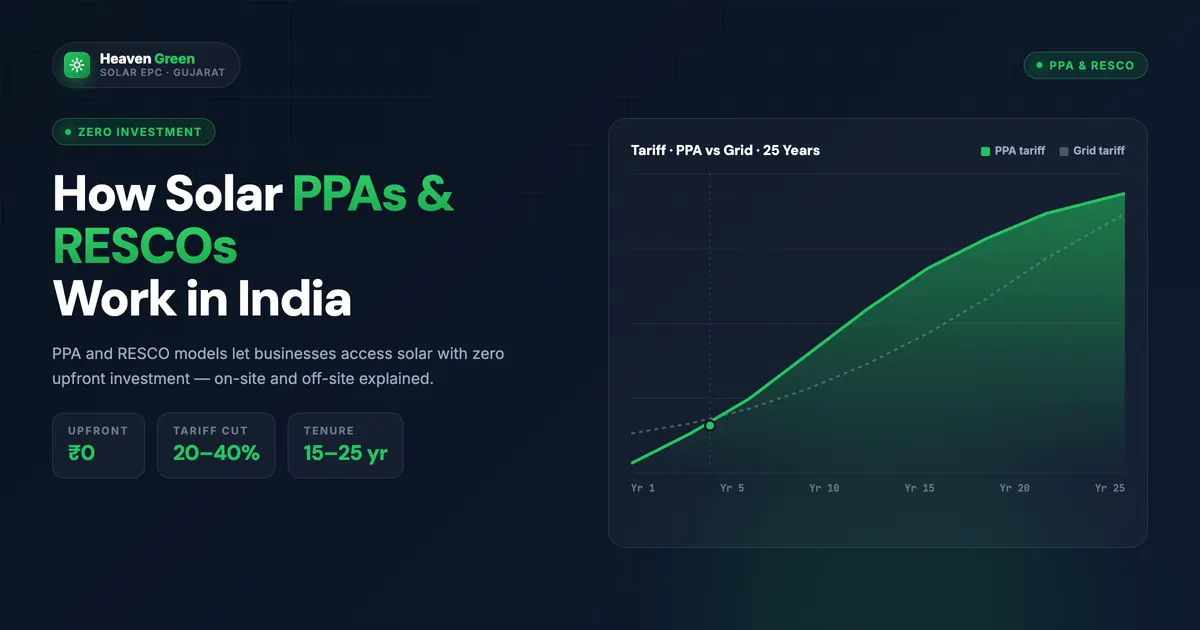
OPEX / RESCO / PPA model. A developer, usually a Renewable Energy Service Company, finances, builds, owns, operates, and insures the system on your rooftop or adjacent land. You sign a 15–25 year Power Purchase Agreement at a fixed ₹/kWh tariff (typically ₹4.50–5.00/kWh in 2026), pay only for the electricity actually generated, and book the entire spend as an operating expense. The developer claims AD, retains export credits, and handles every aspect of system uptime. You get clean power without touching your capital expenditure budget.
CAPEX-Lite / hybrid. A growing middle path where the buyer pays 20–30% upfront and finances the rest through a developer-arranged term loan from IREDA, the Power Finance Corporation (PFC), or a private bank at 8.5–10.5% interest. Ownership transfers to the buyer immediately, so the AD benefit is preserved while working capital impact is muted.
Fast tip
Neither model is universally better. The right answer depends on your taxable profit, ownership horizon, balance-sheet appetite, and operating-risk tolerance. Run the 6-Factor Decision Matrix below before committing, most buyers we meet have already made an assumption that the numbers do not actually support.
The 6-Factor OPEX vs CAPEX Decision Matrix
This is the framework Heaven Green Energy’s commercial advisory team uses across every C&I conversation. Six factors, each scored as CAPEX-favouring or OPEX-favouring. If you tick four or more CAPEX boxes, own the system. If you tick four or more OPEX boxes, sign a PPA. Three-three splits are where hybrid CAPEX-Lite usually wins.
Factor 1, Tax position
If your entity is profit-making and pays corporate tax at 22% (concessional) or 25% (small companies), AD is worth roughly 22–25% of system cost as a Year 1 NPV bump. If you are loss-making, tax-exempt (Section 8 company, trust, hospital under 80G), or in a tax holiday under the Special Economic Zone (SEZ) regime, AD has zero value and OPEX dominates. According to CEEW’s C&I solar tracker, about 60% of CAPEX deployments are by tax-paying mid-market manufacturers precisely because the AD timing matches their fiscal-year tax planning.
Factor 2, Cash flow flexibility
CAPEX needs ₹38–50 lakh per 100 kW upfront. If your working capital cycle is tight, receivables stretched past 90 days, seasonal cash flow, or planned capex elsewhere, OPEX preserves the balance for core operations. The right test: would the same ₹50 lakh deployed in core business earn an after-tax IRR above 18%? If yes, OPEX; if no, CAPEX.
Factor 3, Balance sheet impact
CAPEX adds a depreciating fixed asset and (if debt-funded) a long-term liability. OPEX, under Ind-AS 116 (the Indian equivalent of IFRS 16 lease standard), is typically structured as a service contract rather than a finance lease, keeping it off the balance sheet for most contract structures, though your auditor must confirm the test. Listed companies watching their debt-to-equity covenants often prefer OPEX for this reason.
Factor 4, Ownership horizon
CAPEX shines when you plan to occupy the site for 8+ years. The payback completes in roughly four years; everything from year five onward is pure savings on an asset you own. OPEX makes more sense on leased property, planned divestments, or sites under management transition. Walking away from a PPA at year 7 typically costs a 5–15% termination penalty on remaining contract value.
Factor 5, Operating risk tolerance
Under CAPEX, you bear panel cleaning, inverter servicing, monitoring, fault repair, insurance, and replacement during the 25-year life. A standard AMC at ₹50–80 paise per Wp per year transfers most of this, but final responsibility stays with you. Under OPEX, every uptime obligation sits with the developer; PPAs almost always include a minimum generation guarantee with shortfall compensation. If your facilities team is stretched, OPEX removes the operating burden entirely.
Factor 6, Contract complexity
A CAPEX deal is, at its core, an Engineering, Procurement, and Construction (EPC) contract plus an O&M annexure. An OPEX deal is a 50–80 page PPA covering tariff, escalation, performance ratio, force majeure, exit, change-in-law, indemnity, and termination, typically negotiated over 6–10 weeks. If your legal team has no PPA experience, the negotiation cost itself becomes a factor. CAPEX is simply faster to close.
| Factor | Favours CAPEX if | Favours OPEX if |
|---|---|---|
| Tax position | Profit-making, 22–30% bracket | Loss-making, tax-exempt, SEZ holiday |
| Cash flow | Surplus capital, low alternative-use IRR | Tight working capital, high opportunity cost |
| Balance sheet | Comfortable adding asset + debt | Need off-balance-sheet structure |
| Ownership horizon | 8+ years on the site | Leased, < 7 years certainty |
| Operating risk | Strong facilities team, AMC capacity | Lean ops, want zero responsibility |
| Contract complexity | Want fast close (EPC only) | Have PPA negotiation bandwidth |
CAPEX Model, Cost, AD, ROI Math for 100 kW Commercial
Let’s run a clean 100 kW commercial scenario for a mid-market company in Pune, Maharashtra paying MSEDCL High-Tension (HT) tariff of ₹9.20/kWh, and producing taxable profit above ₹2 crore annually.
System assumptions.
- Installed DC capacity: 100 kWp using tier-1 mono Passivated Emitter and Rear Cell (PERC) modules, ALMM-listed
- Effective AC output: ~92 kW after inverter and Module Mismatch Loss (MML) factor
- Generation: 1,45,000 kWh/year (Pune ~4.2–4.4 Peak Sun Hours per day, 75% Performance Ratio)
- All-in installed cost: ₹42 lakh (₹42/Wp turnkey, GST-inclusive, including net metering and commissioning)
- Tax bracket: 25% under Section 115BAA concessional regime + 4% cess = effective 26%
Accelerated Depreciation math.
| Item | Year 1 | Year 2 | Year 3 |
|---|---|---|---|
| Opening WDV | ₹42,00,000 | ₹25,20,000 | ₹20,16,000 |
| AD rate | 40% | 20% on WDV | 20% on WDV |
| Depreciation | ₹16,80,000 | ₹5,04,000 | ₹4,03,200 |
| Tax saving (26%) | ₹4,36,800 | ₹1,31,040 | ₹1,04,832 |
| Cumulative tax saving | ₹4,36,800 | ₹5,67,840 | ₹6,72,672 |
Year 1 tax saving alone equals 10.4% of project cost. Across three years, you recover ~16% of cost as tax saving, on top of the electricity savings. Combined Year 1 cash-equivalent return: electricity savings of ₹13.3 lakh (1,45,000 kWh × ₹9.20) + tax saving of ₹4.37 lakh = ₹17.67 lakh against a ₹42 lakh outlay, a 42% Year 1 return. Net effective project cost after the full three-year AD cycle settles near ₹35.3 lakh.
Payback. Simple payback period (electricity savings only) = 3.16 years. After AD adjustment, effective payback compresses to about 2.7 years. Twenty-five-year cumulative savings, with 4% grid tariff escalation and 0.6% panel degradation, cross ₹6.5 crore in nominal terms. The IRR for the asset clears 24%. Detailed working is in our solar ROI calculation guide and the accelerated depreciation explainer.
OPEX/PPA Model, Tariff, Tenure, Termination for 100 kW Commercial
Same site, same load profile, but routed through a Renewable Energy Service Company. The developer funds the ₹42 lakh, you sign a 20-year PPA at ₹4.75/kWh with 2.5% annual escalation.
| Item | Year 1 | Year 5 | Year 10 | Year 20 |
|---|---|---|---|---|
| PPA tariff (₹/kWh) | 4.75 | 5.24 | 5.93 | 7.59 |
| Annual generation (kWh) | 1,45,000 | 1,41,500 | 1,37,200 | 1,28,400 |
| PPA bill | ₹6,88,750 | ₹7,41,460 | ₹8,13,596 | ₹9,74,556 |
| Grid bill avoided (₹9.20 + 4% esc.) | ₹13,34,000 | ₹15,60,617 | ₹18,98,540 | ₹28,07,322 |
| Net saving | ₹6,45,250 | ₹8,19,157 | ₹10,84,944 | ₹18,32,766 |
Twenty-year cumulative net savings: roughly ₹2.4–2.7 crore, less than half of the CAPEX case for a profitable buyer, but generated with zero capital outlay, zero operating responsibility, and zero technology risk. The developer keeps the AD benefit, all export credits, and 100% of the residual value.
Termination economics. A typical PPA exit at year 7 carries a penalty of 8–12% of remaining contract value, often calculated as 50–70% of the residual revenue stream discounted at 10%. Translation: walking away early is expensive. Read the full anatomy in our deep dive on how solar PPAs and RESCOs work in India.
What the buyer really receives. Day one electricity at ₹4.75/kWh against a grid rate of ₹9.20/kWh, a 48% reduction on the solar-served portion of the load. For a facility with ₹15 lakh monthly grid bill where solar covers 35% of consumption, the OPEX structure produces immediate monthly savings of ₹2.3–2.6 lakh with zero capital outlay, zero operating responsibility, and a contractual minimum generation guarantee. The developer is responsible for module cleaning, inverter health, generation reporting, insurance, replacement, and any DISCOM coordination.
Performance Ratio guarantee. A serious 2026 PPA contains a Performance Ratio (PR) clause specifying minimum kWh delivered per kWp installed per year, typically 1,400 in Maharashtra and Gujarat, 1,500 in Rajasthan, 1,350 in Karnataka. Shortfall is compensated either as a tariff reduction for the deficit units or as a direct rebate. Without this clause the developer has no skin in the operating game.
Tariff escalation choices. Three structures dominate: flat tariff for the full term (highest year-1 price, no surprises), 2–2.5% annual escalation (most common, balances developer hedge against grid escalation), and Consumer Price Index (CPI)-linked escalation (rare, but useful for sophisticated buyers comfortable with inflation indexation). The right structure depends on your view on grid tariff trajectory. CEEW analysis suggests Indian C&I grid tariffs have escalated at a Compound Annual Growth Rate (CAGR) of 3.8–4.4% over 2018–2025, comfortably above standard PPA escalation.
Developer credit and replacement risk. Your 20-year PPA is only as solid as the developer behind it. Insist on a step-in clause permitting either you or a designated alternate operator to take over O&M if the original developer defaults, a feature increasingly standard since the small RESCO consolidation wave of 2023–24.
Get a free CAPEX vs OPEX assessment. Our commercial engineering team runs both models for your specific load, tariff slab, tax bracket, and roof condition, within 48 hours of a site visit. No charge, no commitment. Get your free quote →
When CAPEX Wins (high-tax-position, long horizon, stable load)
CAPEX is the right answer when at least four of these conditions hold:
- Taxable profit above ₹50 lakh per year. AD has real cash value only against tax actually paid. A loss-carry-forward position effectively wastes the largest single CAPEX advantage.
- Owned property with 8+ year horizon. Asset recovery from a leased property is operationally messy; landlords rarely cooperate, and recovery economics often destroy 30–40% of asset value.
- Stable, predictable load above 60% of system size. Solar is most valuable when self-consumed. If 70%+ of generation lands in your own draw, typical for two-shift manufacturing, CAPEX captures full retail-tariff value.
- Strong facilities team or AMC budget. A well-run AMC costs 0.5–0.8% of system cost per year and preserves output close to design. Without it, year-on-year degradation accelerates.
- Access to capital at or below 11% cost. Either internal accruals, an IREDA-backed loan at 9–10%, or a private term loan. The hurdle rate matters because asset IRR averages 22–24%; capital costing more than that flips the case.
- Long-term occupancy certainty. Family-owned manufacturing, owned office headquarters, multi-decade industrial campuses.
Profile fit: textile mills, plastic injection units, food processing plants, owned warehouses, owned IT campuses, automotive Tier-2 suppliers, ceramic manufacturers, pharmaceutical plants with daytime production shifts. For sector-specific CAPEX scenarios, see OPEX vs CAPEX for textile units.
A worked example: a Morbi ceramic manufacturer running two shifts with ₹40 lakh monthly electricity bill at ₹9.60/kWh is the textbook CAPEX buyer. A 500 kWp system funded 30% from internal accruals and 70% from a 9.25% IREDA-backed loan produces positive cash flow from month one (post-EMI), unlocks ~₹40 lakh in AD tax shield over Years 1–3, and breaks even on the equity portion before month 22. Across 25 years, the same factory captures roughly ₹17–19 crore in nominal energy savings versus a comparable PPA case capped near ₹8 crore. The decision is not even close once the tax position is locked in.
CAPEX also unlocks two value streams that OPEX cannot. First, Renewable Energy Certificates (RECs): even though most C&I rooftop systems do not currently register for the REC mechanism, the option remains open for an asset owner. Second, carbon credits and Scope 2 emissions reporting: under Securities and Exchange Board of India (SEBI) Business Responsibility and Sustainability Reporting (BRSR) rules effective for the top 1,000 listed companies, owned renewable assets directly improve Scope 2 disclosures, whereas OPEX claims sit in a contested middle ground that some auditors increasingly treat as unbundled. Tax-paying corporates serious about Environmental, Social, and Governance (ESG) reporting almost always land on CAPEX or CAPEX-Lite for this reason alone.
When OPEX Wins (cash-conscious, variable load, leased property)
OPEX dominates when at least four of these are true:
- Tax-exempt or low-profit status. Charitable hospitals, Section 8 companies, schools, NGOs, early-stage startups. AD value is zero, so the CAPEX tax shield disappears.
- Leased premises or short ownership horizon. A 5-year lease with two-year extension options does not match a 25-year asset.
- Capital expenditure budget already committed. When the next ₹50 lakh is earmarked for a new production line, the right decision is to keep capital on the core business and lease the energy savings.
- Variable or seasonal load profile. Schools (closed in summer), cold storage (seasonal peaks), hospitality (occupancy-driven). OPEX costs scale only with actual generation consumed.
- Lean facilities team. No bandwidth for AMC oversight, fault response, or panel cleaning supervision. PPA performance guarantees take all of this off your plate.
- Off-balance-sheet preference. Listed companies watching debt covenants, private equity-backed firms with strict capex caps, group treasury functions optimising consolidated debt ratios.
Profile fit: hospitals, school chains, hotels, Business Process Outsourcing (BPO) units in leased commercial towers, multi-tenant business parks, early-stage startups, cold storage operators, dairy cooperatives, government and quasi-government buildings. For the hospital case study, see OPEX vs CAPEX for hospitals.
A working example: a 300-bed multi-specialty hospital in Ahmedabad with ₹22 lakh monthly grid bill at ₹9.40/kWh signed a 25-year OPEX PPA for 400 kWp at ₹4.85/kWh with 2.25% annual escalation. Zero capex outlay, day-one monthly saving of ₹4.6 lakh, no maintenance burden on facilities staff who are stretched managing biomedical equipment. The hospital does not pay corporate tax (Section 12A registration), so AD is irrelevant; the developer captures that benefit in its own books. Over 20 years, the hospital saves a cumulative ₹14–16 crore, less than CAPEX would have delivered, but the alternative was no solar at all, because the ₹1.6 crore upfront equivalent was unaffordable against a planned new MRI suite.
The OPEX advantage also extends to multi-site groups in expansion mode. A retail chain rolling out 40 new outlets per year cannot park ₹50 lakh of capital per site into solar without disrupting its core capital allocation. A master PPA structured across the portfolio, fixed tariff, common Service Level Agreement (SLA), shared performance dashboard, lets the chain decarbonise as it grows without consuming a single rupee of expansion capital. This is increasingly how listed retail, Quick Service Restaurant (QSR), and logistics groups deploy renewable energy in 2026.
Sector Verdicts: Hospital, Textile, IT Office, Factory
Different industries have structurally different answers because their tax profile, property tenure, load curve, and risk appetite vary. Here is our verdict from 400+ commercial conversations across Gujarat, Maharashtra, and Rajasthan in 2024–26.
1 MW Industrial Scenario (Textile, Surat)
To anchor the sector verdict, here is the headline math for a 1 MW industrial deployment.
| Item | CAPEX | OPEX |
|---|---|---|
| Upfront cost | ₹3.9 crore | ₹0 |
| Year 1 generation | 14,50,000 kWh | 14,50,000 kWh |
| Year 1 effective tariff to plant | ₹0 (own) | ₹4.65/kWh |
| Year 1 grid avoidance @ ₹9.50/kWh | ₹1.38 cr | ₹1.38 cr |
| Year 1 PPA bill | , | ₹67.4 lakh |
| Year 1 net cash saving | ₹1.38 cr | ₹70.4 lakh |
| Year 1 AD tax shield (26%) | ₹40.6 lakh | , |
| 25-year nominal saving (4% esc.) | ₹62–68 crore | ₹26–30 crore |
Sector verdict matrix
| Sector | Property | Tax position | Load profile | Verdict |
|---|---|---|---|---|
| Hospital (private) | Often leased / mixed | Often Section 80G, low effective tax | 24×7 stable | OPEX: zero capex, day-one savings, developer carries uptime risk |
| Hospital (corporate chain) | Owned campus | Taxable, profitable | 24×7 stable | CAPEX: AD benefit material, long horizon |
| Textile mill | Owned | Taxable | Two-shift, high daytime load | CAPEX: best self-consumption match, fastest payback |
| Spinning unit (leased shed) | Leased | Variable | High daytime load | OPEX: preserves capital, no recovery risk |
| IT office (owned tower) | Owned | Taxable | Weekday daytime | CAPEX-Lite: moderate size, balanced cash impact |
| IT office (leased floor) | Leased | Taxable | Weekday daytime | OPEX: landlord-led PPA structure or skip |
| Manufacturing factory (mid-tier) | Owned | Taxable | Two-shift | CAPEX: textbook fit |
| Cold storage | Owned | Low profit, seasonal | Seasonal peaks | OPEX: tariff scales with usage |
| Educational campus | Owned trust | Tax-exempt | Daytime, seasonal | OPEX: no AD value, predictable bills |
See commercial solar services and industrial solar services for our sector-specific delivery scope.
Common Mistakes in CAPEX/OPEX Decisions
These are the recurring errors we see in board memos and CFO presentations.
-
1
Ignoring AD value when modelling CAPEX. Skipping the Section 32 calculation makes CAPEX payback look 8–10 months longer than reality. Always run net-of-AD payback for a tax-paying entity.
-
2
Comparing PPA Year 1 tariff against current grid rate only. Compare lifetime NPV. A ₹4.75/kWh PPA with 3.5% escalation often crosses ₹8.50/kWh by year 15, meaningful when grid escalation runs at 4%.
-
3
Choosing OPEX on a leased property without landlord NOC clauses. The PPA depends on rooftop access; if the landlord can revoke roof rights, the developer prices that risk into the tariff or refuses to bid.
-
4
Underestimating CAPEX O&M cost. AMC at 0.5–0.8% of project cost is realistic; assuming 0.2% breaks the long-run economics. Budget honestly.
-
5
Signing a PPA with weak Performance Ratio guarantee. Insist on minimum kWh/kWp/year clause, typically 1,400–1,600 depending on location, with shortfall compensation. Without it, the developer has no incentive to keep panels clean.
-
6
Forgetting [GST Input Credit](/glossary/gst-input-credit) under CAPEX. Solar projects attract 13.8% GST (12% on the supply portion + cess effects). For a registered taxable business with output GST, this is recoverable as input credit, further reducing effective CAPEX cost by 8–10%.
-
7
Not stress-testing the PPA termination clause. A buyout at year 10 priced at 60% of remaining revenue is fundamentally different from one priced at residual book value. Read it before you sign it.
Watch out
A "discounted" OPEX tariff of ₹3.99/kWh with 5% annual escalation will cross the original ₹4.75/kWh + 2.5% PPA by year 6 and stay above it for the remaining 14 years. Always model the full tenure NPV, never the headline Year 1 tariff alone. Mercom India's 2025 C&I PPA tracker shows that 38% of OPEX deals signed at sub-₹4.20/kWh carried escalation clauses above 4.5%.
CAPEX vs OPEX Summary by Decision
- 25-year owned asset with residual value at end
- 40% + 20% AD tax shield under Section 32
- GST input credit recovery for registered taxpayers
- Full retail-tariff savings from year 1
- No lifetime tariff escalation risk
- Freedom to expand, modify, or sell the asset
- Upfront ₹38–50 lakh per 100 kW
- O&M, fault, and insurance responsibility
- AD value is zero for loss-making firms
- Asset recovery painful on leased property
- Adds debt + asset to balance sheet
- Zero upfront capital expenditure
- Developer carries every operating risk
- Off-balance-sheet under most Ind-AS 116 tests
- Tariff still 35–50% below grid from day one
- Works on leased premises
- Useful for tax-exempt entities
- Lifetime value 40–55% lower than CAPEX
- 15–25 year lock-in with exit penalty
- Developer captures AD + export credits
- Tariff escalation erodes long-term savings
- PPA negotiation cycle 6–10 weeks
- Developer creditworthiness is now your risk
Verdict. For a tax-paying mid-market commercial buyer with owned property and 8+ years of site certainty, CAPEX is the answer, payback inside four years, twenty-five-year IRR above 22%, and full asset ownership. For hospitals, schools, leased-premise tenants, and capital-constrained operators, OPEX delivers immediate savings without disturbing the balance sheet. The middle ground, CAPEX-Lite with 25–30% equity and 70–75% IREDA-backed debt, solves for buyers who want ownership economics without the working-capital hit. See the older OPEX vs CAPEX guide for our 2025 perspective on the same trade-off.
How Heaven Green Energy Structures Both
Heaven Green Energy delivers commercial and industrial solar across Gujarat, Maharashtra, and Rajasthan with two parallel commercial structures.
CAPEX delivery, direct. Full solar EPC scope: detailed site survey, single-line diagram, structural and electrical design, ALMM-listed module procurement, Central Electricity Authority (CEA) certified Bureau of Indian Standards (BIS) inverters, mounting structure fabrication, AC/DC cabling, net metering coordination with the State Electricity Board, commissioning, and handover. Backed by a 25-year performance warranty, 5–12 year inverter warranty, and an AMC with monthly cleaning + remote monitoring. Heaven Green provides every document your CA needs for Section 32 AD claim and GST input credit recovery.
OPEX / PPA, through vetted RESCO partners. For clients who fit the OPEX profile, we run a competitive bid among 3–4 pre-vetted Renewable Energy Service Companies operating under our standardised PPA template, fixed tariff or 2–2.5% escalation, generation-linked performance guarantee, transparent termination clause, and a buyout option at year 10 at residual book value. We sit on your side of the table during negotiation.
Our process, same for both models:
- Site visit and load analysis within 48 hours of enquiry (free).
- CAPEX vs OPEX model specific to your tariff slab, tax bracket, and roof condition.
- Design, BoM (Bill of Materials), and timeline lock.
- Permits, net metering, and DISCOM coordination.
- Installation and commissioning, 6–10 weeks for systems up to 1 MW.
- Handover, monitoring activation, AMC or PPA performance reviews.
Across both models, our delivery scope includes structural load analysis (especially relevant for sheds with span constraints), wind-zone classification per IS 875 Part 3, lightning protection per IS/IEC 62305, and earthing per IS 3043, non-negotiable elements that distinguish a code-compliant industrial install from a residential-grade rooftop. Our O&M layer adds real-time generation telemetry via SCADA (Supervisory Control and Data Acquisition) integration, monthly cleaning cycles, semi-annual thermal imaging of modules and inverters, and a 24-hour fault response Service Level Agreement.
For CAPEX clients, we also coordinate the GST input credit recovery workflow with your tax consultant and provide the asset depreciation schedule formatted to fit directly into the fixed-asset register your Chartered Accountant maintains. For OPEX clients, we run the annual PPA performance reconciliation, comparing actual generation against contracted Performance Ratio and flagging any shortfall compensation owed by the developer. Most clients find the second-year PPA reconciliation recovers 0.5–1.5% of contracted generation that would otherwise be quietly absorbed.
Start with a free quote at Contact Heaven Green or read the deep dive on solar payback math before your next board meeting.
Frequently Asked Questions
Is CAPEX always better than OPEX for a profitable company?
Not always. CAPEX wins for profitable companies on owned property with stable load and an 8+ year horizon, the AD benefit and zero tariff escalation drive lifetime NPV 1.8–2.2x higher than OPEX. However, if the same capital can earn over 22% after-tax IRR in your core business, OPEX preserves that flexibility. The honest test is a side-by-side NPV under your real cost of capital, not a generic comparison.
How does Accelerated Depreciation actually work for solar in 2026?
Under Section 32 of the Income Tax Act, solar power plants depreciate at 40% on Written Down Value (WDV) in Year 1 plus 20% on WDV in subsequent years until the asset is fully written off, typically by Year 7. For a 100 kW system costing ₹42 lakh in the 26% effective tax bracket, the cumulative cash-equivalent AD benefit over three years is roughly ₹6.7 lakh, about 16% of project cost, compressing payback by 8–10 months.
What is a typical 2026 PPA tariff and escalation for commercial OPEX?
Mercom India’s Q1 2026 C&I tracker places typical fixed-or-mildly-escalating PPA tariffs at ₹4.50–5.00/kWh for systems above 250 kW and ₹4.80–5.40/kWh for systems 100–250 kW. Standard escalation is 2.0–2.5% per annum. Aggressive sub-₹4.20/kWh quotes often carry 4–5% escalation, model the full tenure NPV before accepting them.
Can a tax-exempt hospital or school benefit from CAPEX?
Yes, but only on cash-yield grounds. AD benefit has zero value for a tax-exempt institution, so the entire CAPEX case depends on electricity savings versus capital cost. Payback typically stretches to 4.5–5.5 years (versus 3.5–4 for a taxable buyer), and 25-year savings remain attractive. Most tax-exempt institutions still prefer OPEX because zero upfront cost matches their grant-driven capital cycle better.
What happens to my PPA if I sell or vacate the property mid-tenure?
Standard PPAs include a change-of-control or change-of-site clause. The new occupant typically assumes the PPA, or the developer triggers a termination payment from the original signatory, usually 5–15% of remaining contract value, sometimes calculated as 50–70% of residual revenue discounted at 10%. Always negotiate the exit clause; default termination math often makes early exit prohibitively expensive.
Can I switch from OPEX to CAPEX during the PPA?
Yes, most PPAs include a buyout option, often at year 5, year 10, or both. Buyout price is typically the higher of residual book value or 50–60% of remaining contract NPV. A buyout at year 10 transfers ownership and unlocks remaining AD on the residual value (calculated on the buyout price), though the lion’s share of AD has already accrued to the developer.
How is OPEX treated on the balance sheet under Ind-AS 116?
Indian Accounting Standard 116, the lease accounting standard equivalent to IFRS 16, requires evaluating whether a contract conveys the right to control an identified asset. Most well-drafted solar PPAs are structured as service contracts (the developer retains operational control) and remain off-balance-sheet. Long-take-or-pay PPAs with no performance risk can trip the test and become a recognised right-of-use asset plus liability. Your auditor must confirm the treatment.
Is OPEX available for systems below 100 kW?
Most established RESCOs target deals above 250 kW because transaction costs (legal, financing, monitoring) do not scale below that ticket size. For systems between 100 kW and 250 kW, OPEX is available but at slightly higher tariffs (₹5.00–5.50/kWh) and from a narrower bidder set. Below 100 kW, CAPEX with IREDA-backed debt is usually the only practical path.
What is the AD rate change history for solar?
Solar power generation assets carried 80% Accelerated Depreciation under Section 32 until the Finance Act 2017 rationalised the rate to a maximum of 40% effective April 2017. The 40% Year 1 + 20% WDV rate has been stable through subsequent finance acts and is the rate applicable in financial year 2026. The Ministry of New and Renewable Energy continues to recognise solar as eligible for the highest depreciation slab.
Who claims net metering export credits under OPEX?
The net metering connection sits in the developer’s name under most OPEX structures, so any export credits flow to the developer rather than to your account. If your generation profile is likely to produce material export surplus (typically 15–25% of annual generation for daytime-load businesses), CAPEX captures that value directly. Negotiate a sharing mechanism explicitly into the PPA if export credits matter to you.